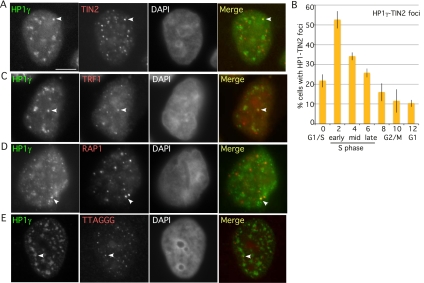
Figure 4.
HP1γ colocalizes with TIN2 at telomeres in S phase. (A,C–E) Immunofluorescence analysis of HeLaI.2.11 cells 4 h after release from a double thymidine block. Cells were extracted with Triton prior to fixation and dually stained with antibodies against HP1γ (green) (A,C–E), TIN2 (red) (A), TRF1 (red) (C), and RAP1 (red) (D), or processed for FISH with a PNA-TTAGGG repeat probe (red) (E). Merge is yellow. Bar, 5 μm. (B) Graphical representation of the frequency of cells containing colocalizing HP1γ–TIN2 foci across the cell cycle. Cells were synchronized by a double thymidine block and released for 0 h (G1/S), 2 h (early S), 4 h (mid S), 6 h (late S), 8 h (G2), 10 h (M), and 12 h (G1). Mean ± SD of three independent experiments (n, ∼100 cells each).

