Figure 5.
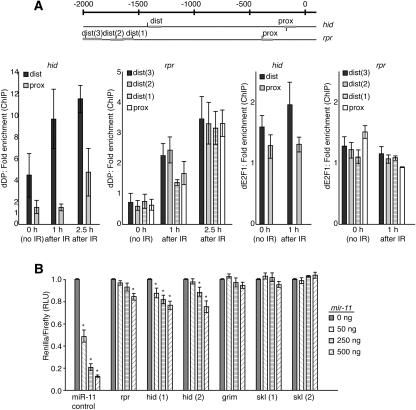
miR-11 and dE2F directly regulate the expression of hid and rpr. (A) Schematics of promoter regions (−2 kb to +100 bp relative to transcription start site) of hid and rpr. RSAT binding site analysis was performed using the NWTSSCSS consensus E2F-binding site (van Helden 2003). Predicted binding sites are shown as vertical lines above and below the promoter region, representing forward and reverse binding site orientation, respectively. Thick gray horizontal bars represent PCR products from primers tested in ChIP. S2R+ cells were exposed to 40 Gy of irradiation, and cells were fixed 1 or 2.5 h later. The 0-h sample was not exposed to irradiation. Sonicated chromatin was immunoprecipitated with an antibody that recognizes dDP, dE2F1, or an IgG control. The level of enrichment from the DP and dE2F1 antibodies was compared with that from the IgG control, and enrichment values were normalized to the RpP0 gene control. (B) 3′ UTR sensor assays were performed in HeLa cells using sequences predicted to be regulated by miR-11 (Leaman et al. 2005). Fifty nanograms of the indicated 3′ UTR sensor plasmid was transfected with the indicated amounts of pcDNA3/empty or pcDNA3/mir-11 plasmids. Cells were harvested 40–48 h post-transfection, and luciferase assay was measured. Error bars represent the standard deviation. (*) P < 0.05 in paired t-tests. A minimum of three independent transfections was performed for each sensor construct.

