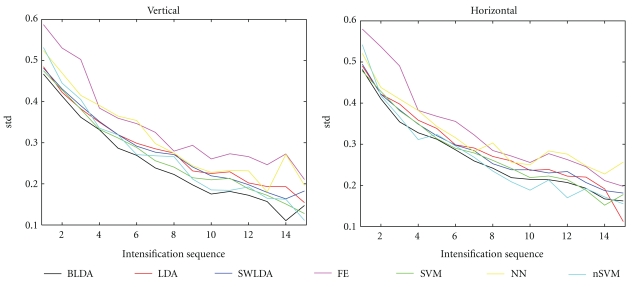
Figure 6.
Standard deviations of the vertical distance (left panel) and horizontal distance (right panel) between the typed and desired characters, as a function of the number of intensifications, for each considered classifier: Bayesian linear discriminant analysis (BLDA), Fisher's linear discriminant analysis (LDA), stepwise linear discriminant analysis (SWLDA), a method based on feature extraction (FE), linear support vector machine (SVM), multilayer perceptron (NN), and Gaussian kernel Support Vector Machine (nSVM).

