
Figure 1.
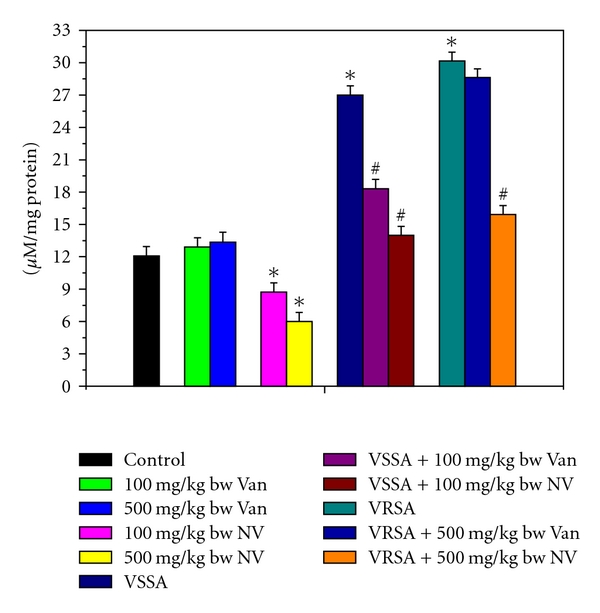
Nitrite generation (NO) in control, 100 mg/kg bw/day vancomycin, 500 mg/kg bw/day vancomycin, 100 mg/kg bw/day nanoconjugated vancomycin, 500 mg/kg bw/day nanoconjugated vancomycin, VSSA infection control, VSSA infection + 100 mg/kg bw/day vancomycin, VSSA infection + 100 mg/kg bw/day nanoconjugated vancomycin, VRSA infection control, VRSA infection + 500 mg/kg bw/day vancomycin, VRSA infection + 500 mg/kg bw/day nanoconjugated vancomycin for 10-day treated lymphocytes. Values are expressed as mean ± SEM, n = 6. *indicates significant difference (P < 0.05) compared to control group. #indicates significant difference (P < 0.05) compared to infection control group.