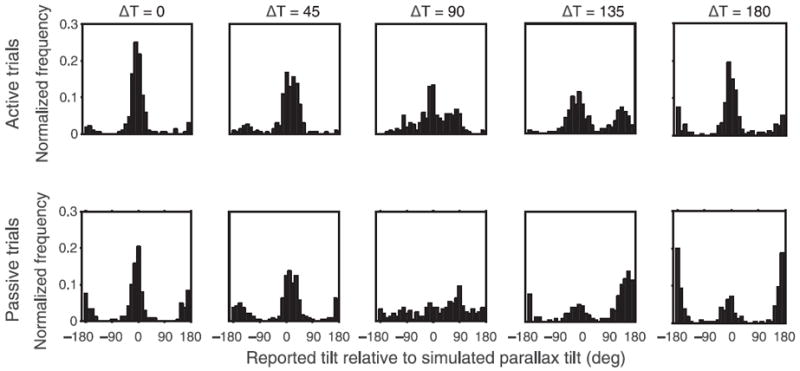
Figure 2.

Histograms show the proportion of trials as a function of reported tilt for different values of ΔT. The top row corresponds to active trials and the bottom row corresponds to passive trials. Response tilt = 0° and 180° corresponds to motion cue-defined tilts while response tilt = ΔT corresponds to perspective cue-defined tilt. Data replicate of those of Wexler, Panerai et al. (2001).
