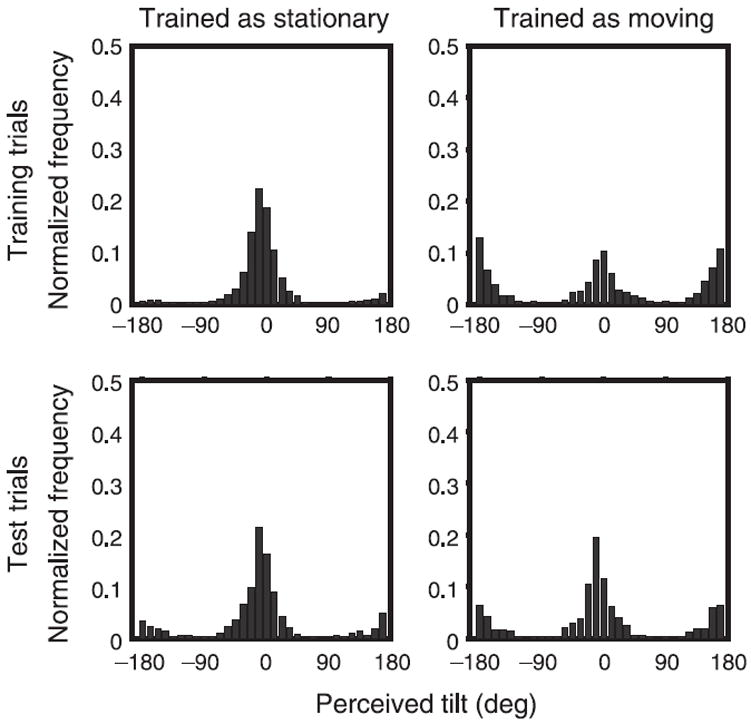
Figure 5.

Histograms show the proportion of trials as a function of perceived tilt for all observers. A tilt response of 0° implies that the grid was perceived as stationary, while a response of 180° implies that the grid was perceived as moving. The top and bottom rows represent training and test trials, respectively, while the columns represent the two training types pooled across all observers and all blocks.
