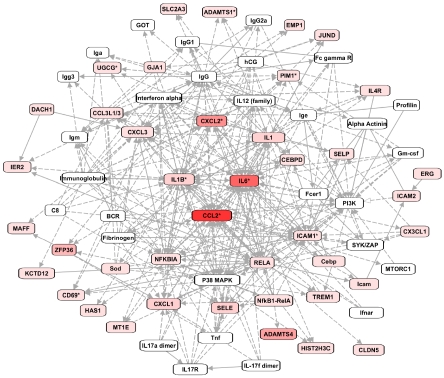
Figure 1.
The top network of differentially expressed (DE) genes, as constructed by Ingenuity Systems Pathway Analysis (IPA). Rectangles in red represent genes significantly upregulated after two hours of thoracic surgery (color intensity indicates the magnitude of upregulation). White rectangles are hub molecules, of which expression is not altered, but that generally have many connections with DE genes. Uninterrupted and interrupted lines indicate physical and indirect intreactions between molecules.

