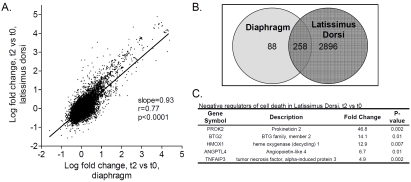
Figure 2.
A. Correlation between the gene expression changes in the diaphragm and those in latissimus dorsi at t2. Note the strong and significant correlation. B. Venn-diagram showing the number of genes that were differential in both diaphragm and latissimus dorsi and the number of genes that were differential exclusively in diaphragm or in latissimus dorsi. C. Table listing the top 5 genes involved in negative regulation of programmed cell death that were differential exclusively in the latissiums dorsi at t2.

