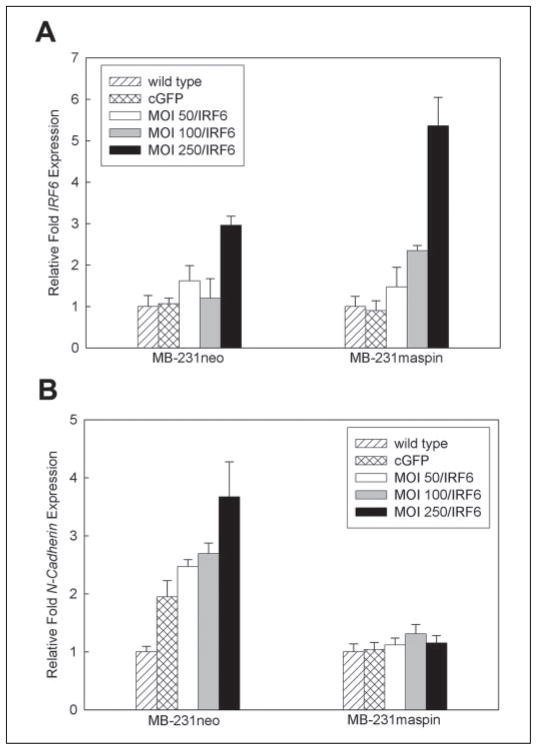
FIGURE 7. Real-time PCR analysis demonstrating changes in N-cadherin expression following Ad5 IRF6 infection of MDA-MB-231 cells.
A, verification of IRF6 expression in MB-231neo and MB-231maspin cells following infection with various concentrations of Ad5 IRF6 (m.o.i. 50, 100, 250). B, changes in N-cadherin expression in the same cells infected with Ad5 IRF6 (m.o.i. 50, 100, 250).

