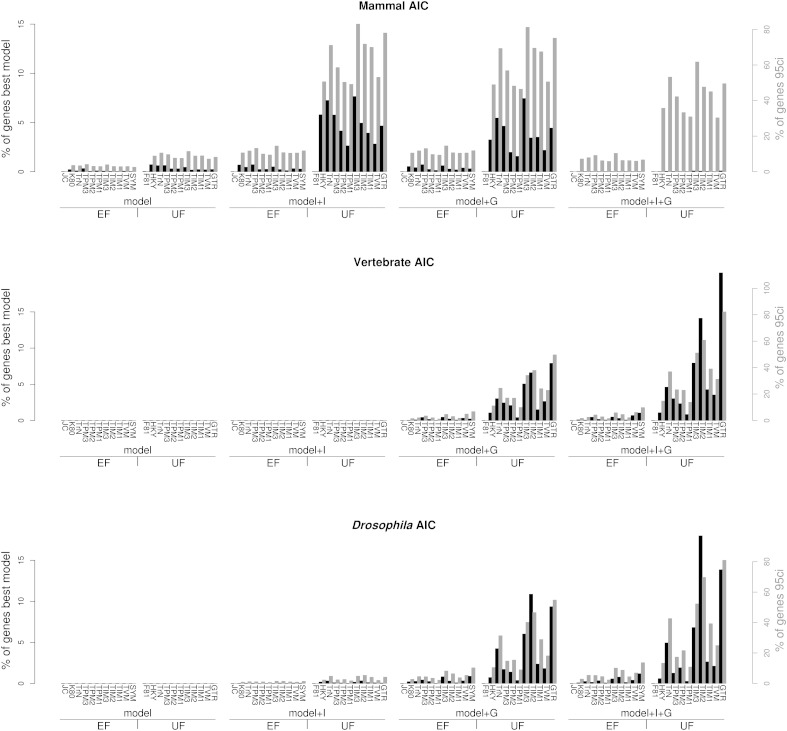
Fig. 1.—
Genome-wide model diversity. Bars represent the percentage of times a given substitution model (x axis) is the best model (black bars, left y axis) or is included in the 95% CI (95ci: gray bars, right y axis) using AIC. Models are shown grouped according to their base frequency and rate variation among sites parameterization and ordered by increasing number of parameters within each group (see table 1).

