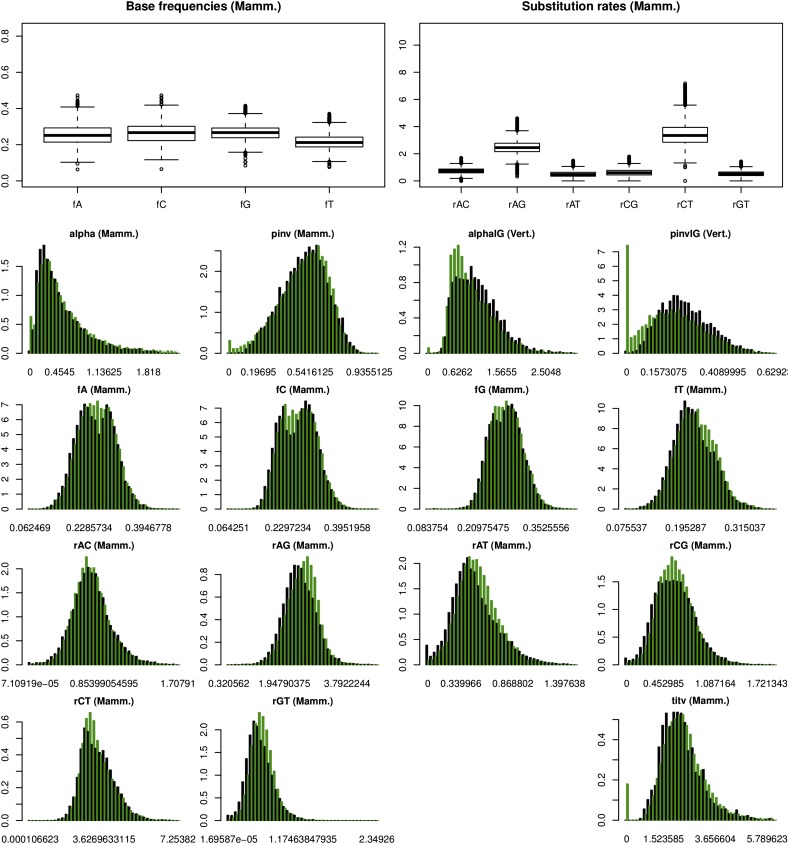
Fig. 4.—
Genome-wide parameter estimate distributions. Examples are shown for estimates derived from the AIC best-fit model (black) and the weighted average of all models in the 95% AIC CI (green). All parameters shown, except alphaIG and pinvIG derived from the 15 species set, are from the five species set. pinv, pinvIG and alpha, and alphaIG are the proportion of invariant sites and shape parameter of the gamma distribution used to model rate variation among sites from the +I (with a considerable representation in the mammal set only) or +I+G models (with considerable representation in the 12 and 15 species sets only), respectively. ti/tv is the transition/transversion rate ratio—considerably represented only in the five species set. Relative substitution rate estimates were “scaled” to facilitate comparisons (see Materials and Methods).

