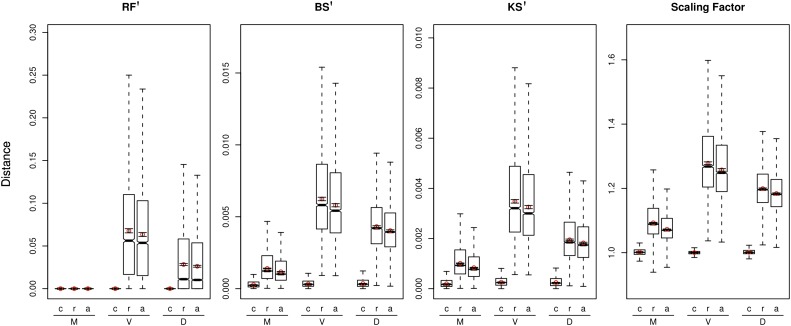
FIG. 5.—
Model selection and tree distances. Boxplots show rescaled mean tree distances to the best-fit model tree from trees estimated under models within the ci95 set (c), models outside of the ci95 set (r), and all models (a = c + r). Four different metrics are shown: RF′ = symmetric difference distance per clade, BS′ = branch score distance per branch, KS′ = K-score distance per branch, and SF = scaling factor. 99% CIs are shown as whiskers extending from the red points. CIs were inferred excluding outliers—estimates falling beyond 1.5 times the interquartile distance.

