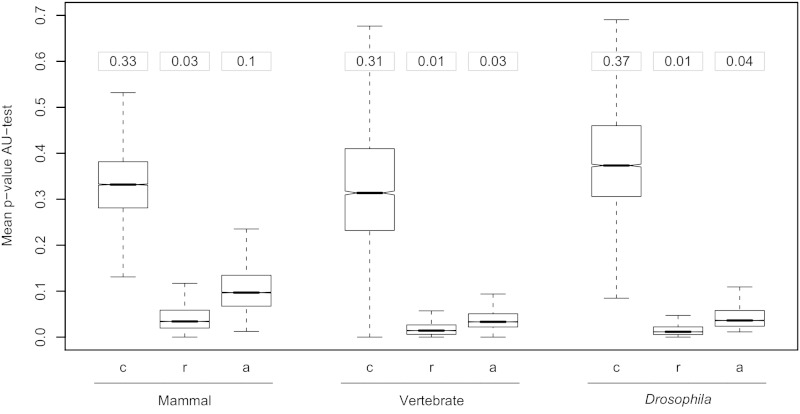
Fig. 6.—
Model selection and phylogenetic inference. Boxplots show the distributions of the P values for the AU test estimated under models within the ci95 set (c), models outside of the ci95 set (r), and all models (a = c + r). Whiskers depict the largest value within 1.5 times the interquartile distance of each distribution. Values in boxes above plots show the overall mean for each distribution.

