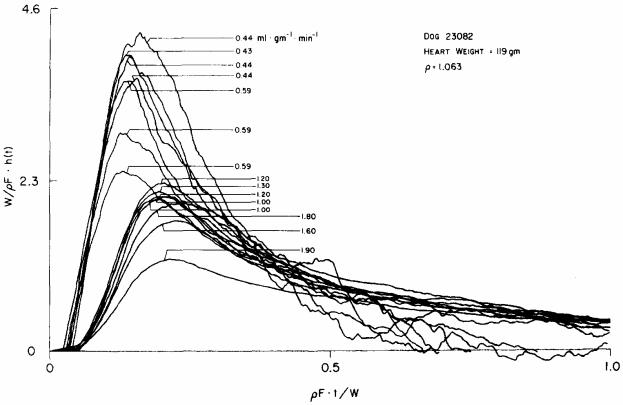
Fig. 6.
Transcoronary transport functions for thermal indicator at various flows. Thermal indicator was injected into the aortic root in an isolated blood-perfused dog heart and the resultant temperature change in the coronary sinus outflow was recorded from a thermistor. Normalization of the axes is the same as in Fig. 5. The flows are indicated for each of the curves. At low flows there is much higher earlier appearance of indicator in the outflow. The curves tended to become more similar at higher flows.

