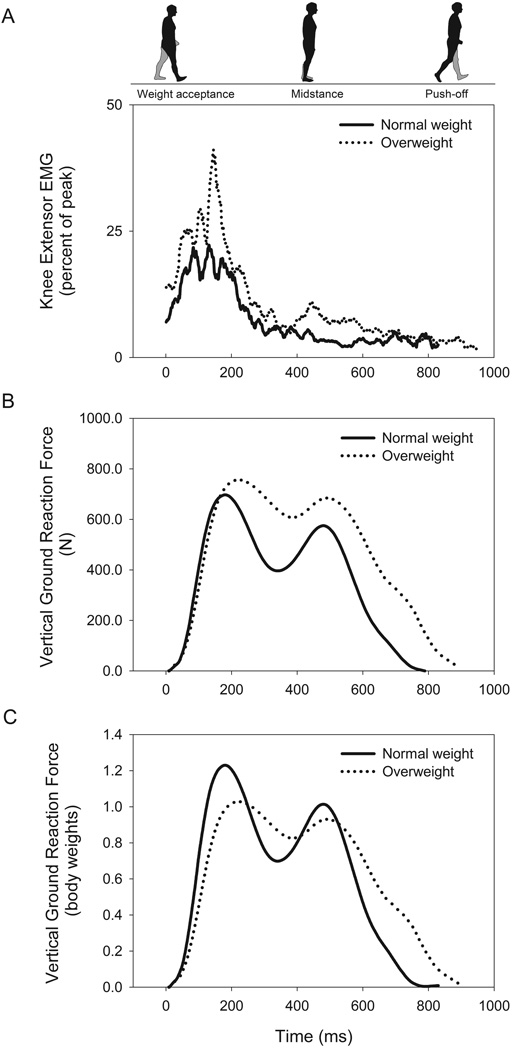
Figure 1.
Differences in muscle activation of the knee extensors (A), absolute vertical ground reaction force (B), and vertical ground reaction force relative to body weight (C) between normal weight and overweight groups during maximal walking. Solid line represents the mean response of those with normal body mass indices (BMI < 25 kg m−2) and dotted line represents the mean response of those with overweight body mass indices (> 25 kg m−2).

