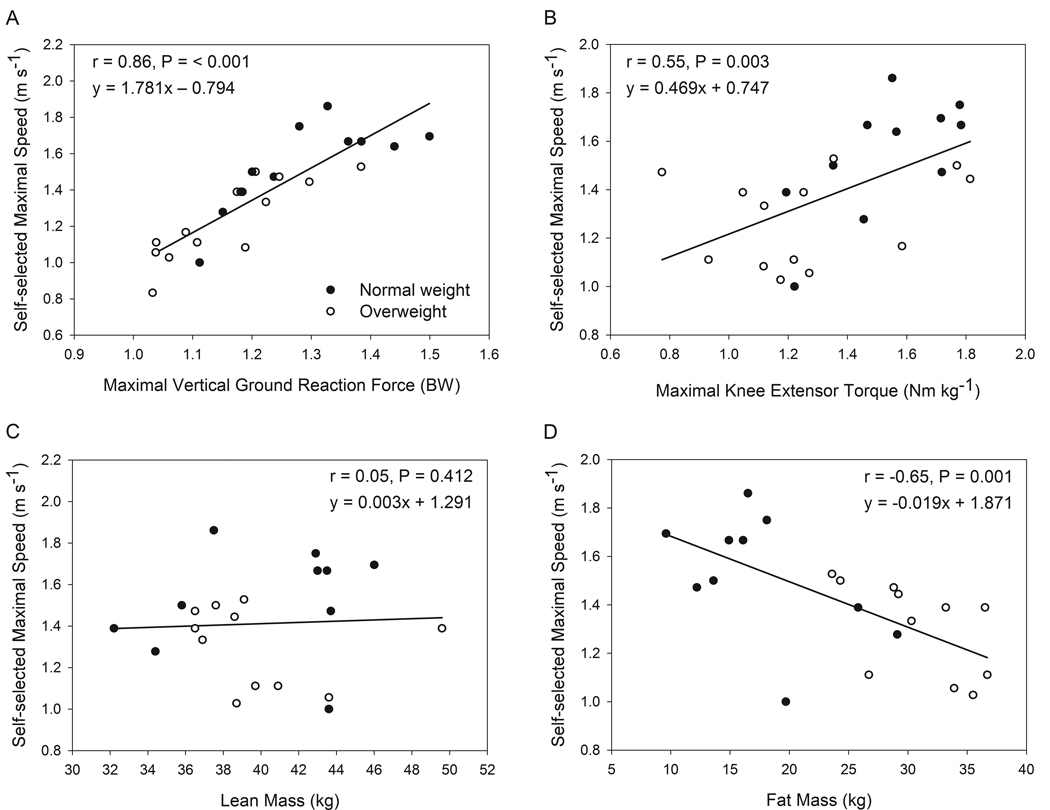
Figure 3.
Pearson product moment correlations associating self-selected, maximal walking speed with maximal vertical ground reaction force (A), maximal knee extensor torque (B), lean body mass (C) and body fat mass (D). Closed circles represent those with normal body mass indices (BMI < 25 kg m−2) and open circles overweight body mass indices (> 25 kg m−2). BW = body weights.

