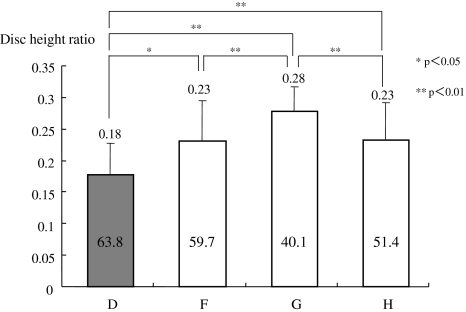
Fig. 2.
Disc height ratio of the groups with/without a typical instability factor. Groups D, F, G, and H represent the same groups as in Fig. 1. Age and disc height differences were more distinctive. The closed bar indicates the disc height ratio of the group which had SN factor alone

