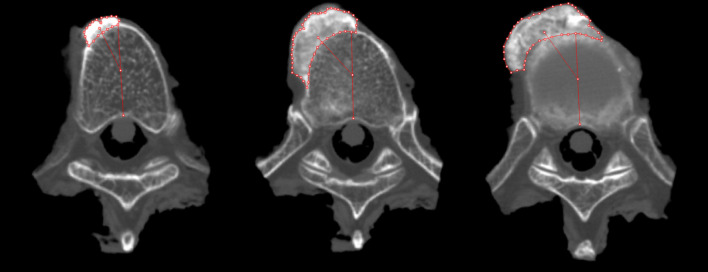
Fig. 3.
Three processed transverse computed tomography images from the same cadaveric specimen (left at mid-vertebral level, middle at adjacent cranial level, right at intervertebral disc space level) showing the graphical method used to delineate the anterolateral ossification mass and angle between the centroid and anteroposterior axis

