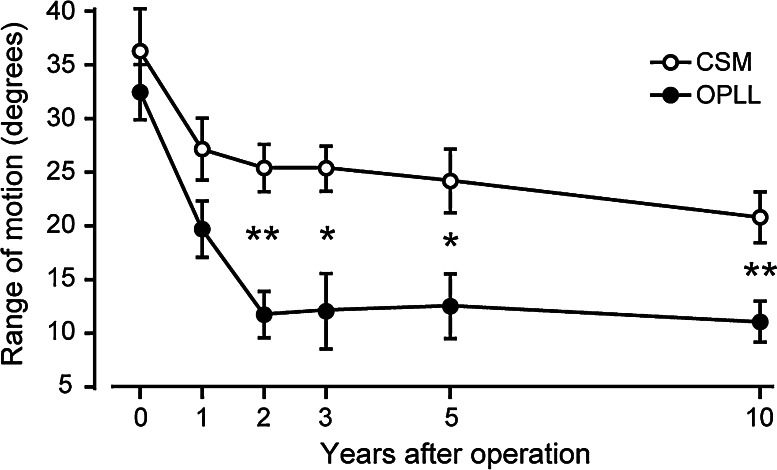
Fig. 2.
Changes in cervical ROM. The cervical ROM decreased over time and reached a plateau by 2 years after surgery. The reduction in ROM was significantly larger in the OPLL group compared to the CSM group (66 vs. 43%, P = 0.0052) at the final follow-up. Bars indicate standard errors: *P < 0.05, **P < 0.01

