The authors present a novel method to study protein and small-molecule diffusion across Bruch's membrane (BM) as a function of Stokes radius (RS) by simultaneously measuring the flux of multiple solutes ranging in RS from <1.0 to 6.15 nm. Although pig tissue was used in this study, the authors were able to evaluate small enough regions of BM/Ch to permit future studies on rat or mouse tissue, or to compare diffusion across BM/Ch underlying different regions of the retina such as macula versus periphery.
Abstract
Purpose.
To determine the effect of Stokes radius (RS) on the diffusion of molecules through Bruch's membrane (BM), and to establish a system suitable for the analysis of diffusion through small (<2 mm2) samples of BM.
Methods.
Porcine BM/choroid (BM/Ch) was mounted in a modified Ussing chamber. A concentration gradient was simultaneously established for four tracers with RS values ranging from <1.0 to 6.15 nm. Samples were collected from both chambers at various time points up to 36 hours and the amount of each tracer was determined using quantitative gel exclusion chromatography. The integrity of samples was determined using scanning electron microscopy.
Results.
BM/Ch mounted in the chamber exhibited no obvious damage even after 36 hours in the chamber. Flux was significantly (P < 0.05) greater in the BM to Ch direction than that in the Ch to BM direction for only two of the tracers: cytosine and RNase A. Flux also was dependent on RS; cytosine, the smallest tracer (RS < 1 nm), exhibited the greatest flux and ferritin (RS = 6.15 nm) the least. Permeability coefficients for each tracer were determined and exhibited a power relationship with RS.
Conclusions.
Flux was dependent on the direction of the concentration gradient and the RS of the individual tracers. We have successfully demonstrated that quantitative gel exclusion chromatography can be used to follow diffusion of a mixture of tracers across BM/Ch, and that we can measure flux across BM/Ch preparations with an exposed surface area as small as 1.8 mm2.
Age-related macular degeneration (AMD) is the leading cause of vision loss in the United States.1 Although the disease presents in both “wet” and “dry” forms,2 vision loss ultimately results from the death of retinal photoreceptors. Photoreceptors comprise the outermost layer of the neurosensory retina and are separated from their blood supply by the retinal pigment epithelium (RPE).3 RPE cells regulate the traffic of essential nutrients to the photoreceptors and the disposal of their metabolic wastes into the blood. The choroid constitutes the vascular supply for both photoreceptors and RPE, consisting of layers of large and intermediate size blood vessels and a layer of capillaries (choriocapillaris). The RPE is separated from the choriocapillaris by a multilaminar extracellular matrix called Bruch's membrane (BM), which consists of five layers. The external most two layers consist of the basal laminae of the RPE and that of the endothelial cells of the choriocapillaris. At the center is a layer of elastic fibers, separated from the RPE or endothelial basal lamina by a layer of collagen fibers. Diffusion of nutrients and waste is thought to occur freely across BM, provided they fall within its size exclusion limit.4 Starita et al.5 demonstrated that diffusion across BM was highly compromised in one eye obtained from a donor with AMD, suggesting that deposits present within BM or between BM and the RPE may serve as a barrier to the effective diffusion of solutes.
Earlier studies have evaluated both the change in transport of water and solutes across BM as a function of age and lipid deposition.5,6 Hydraulic resistance of human BM increases with age,7 which has been correlated to an age-related increase in lipid content.7–9 Similarly, there is an age-related increase in resistance to the transport of solutes across BM.10 In the case of solutes, diffusion is restricted by the size exclusion limit of the membrane, which depends on the porosity created by the density of packing of membrane fibers, interfiber matrix, and the presence or the absence of lipid-rich deposits.10,11
Past in vitro and in vivo studies of the permeability of BM to macromolecules determine a theoretical size exclusion limit of BM, ranging from a Stokes radius (RS) of 5.92 nm11 to a radius corresponding to that of larger lipoproteins,12,13 which lies in the range of 7 to 13 nm for high-density lipoproteins14,15 and up to 22 nm for low-density lipoproteins.16 These studies have often used randomly coiled linear polymers (dextrans) to assess the macromolecular dynamics of aging human Bruch's membrane. Hussain et al.17 showed that dextrans with an RS value of 13.1 nm (500 kDa) can slowly diffuse through BM and that there is an age-related decline in diffusion of this dextran. However, Hussain et al.17 recognized that dextrans cannot be compared with globular proteins, since they are long flexible chains that can cross the membrane by different mechanisms in areas where globular proteins will be restricted. Clearly, there is still much to understand about the dynamics of macromolecular diffusion across BM.
In this study we present a novel method to study protein and small-molecule diffusion across BM as a function of RS by simultaneously measuring the flux of multiple solutes ranging in RS from <1.0 to 6.15 nm (molecular mass from 100 to 450,000 Da) using quantitative gel exclusion chromatography. We further introduce a simple means to modify a commercially available Ussing chamber to permit study of very small pieces (1.8 mm2) of isolated BM/choroid (BM/Ch). Although pig tissue was used in this study, we were able to evaluate small enough regions of BM/Ch to permit future studies on rat or mouse tissue or to compare diffusion across BM/Ch underlying different regions of the retina such as macula versus periphery. Our data suggest that the size exclusion limit of BM exceeds 6.15 nm, although permeability to molecules in this size range is restricted.
Materials and Methods
Isolation and Preparation of Tissue
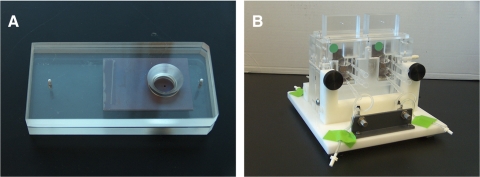
Pig eyes were obtained from the University of Arizona Meat Sciences Laboratory. The eyes were enucleated immediately after euthanatization, stored on ice, and transferred to the laboratory for tissue isolation. The adherent muscles were excised, the lens and vitreous were discarded, and the retina was detached using forceps. The eye cup was filled with PBS (137 mM NaCl, 2.70 mM KCl, 10.1 mM Na2HPO4, 1.80 mM KH2PO4; pH 7.4) and the RPE cells were carefully removed using a fine camel's hair brush to avoid damaging BM. The BM/Ch was detached from the sclera with the aid of forceps and mounted between two corresponding 1.5-mm-diameter holes drilled in pieces of exposed and developed x-ray film (BioMax-MS; Kodak, Rochester, NY) coated with a thin film of silicon grease (Fig. 1).
Figure 1.
Experimental setup. (A) Isolated BM/Ch was placed between two pieces of x-ray film such that it filled a 1.5-mm-diameter hole. The film sandwich was placed between two unbreakable polycarbonate plates (Lexan; Ledmark Industries, Lakewood, NJ) with a larger 120-mm hole. (B) Once the sandwich was assembled it was placed in a modified Ussing chamber. A mixture of proteins (ferritin, albumin, RNase A, and cytosine) dissolved in 4.5 mL of PBS-CM was added to the reservoir on one side of the tissue, with the opposite side containing 4.5 mL of PBS-CM only. Samples were collected from each reservoir after 4, 8, 16, 24, and 36 hours.
Diffusion Studies
Human serum albumin (EMD Chemicals Inc, Gibbstown, NJ), horse spleen ferritin (EMD Chemicals), RNase A (Teknova Inc, Hollister, CA), and cytosine (Sigma-Aldrich, St. Louis, MO) were of the highest purity available. These tracers were selected for their ability to separate cleanly by gel exclusion chromatography. Diffusion properties of tracers through BM/Ch were studied using a dual Ussing chamber (model U2500; Warner Instruments). The BM/Ch x-ray film “sandwich” was mounted in the chamber using a 12-mm round tissue insert with an O-ring (Fig. 1), such that the two sides of the Ussing chamber were separated by the BM/Ch. A mixture of cytosine (molecular weight [MW] = 110.1, RS < 1.0 nm) and the following proteins: RNase A (MW = 13,700, RS = 1.72 nm), albumin (MW = 66,382, RS = 3.55 nm), and ferritin (MW = 450,000, RS = 6.15 nm), dissolved in 4.5 mL of PBS containing 1 mM MgCl and 0.1 mM CaCl2 (PBS-CM), was added to the reservoir on one side of the tissue with the opposite side containing 4.5 mL of PBS-CM only. The initial concentration of each solute (albumin: 24,931 μg/mL; ferritin: 2592 μg/mL; RNase A: 1203 μg/mL; and cytosine: 381 μg/mL) was varied so that peak heights in the initial chromatograms were comparable. Magnetic bars were placed in each chamber to permit continuous agitation of the solutions for the duration of the experiment. Sample aliquots of 0.7 mL were withdrawn at time intervals of 4, 8, 16, 24, and 36 hours from each chamber for quantification of proteins.
Determination of Flux and Diffusion Coefficients
Flux (J) was calculated using Eq. (1), where C is the accumulated molar concentration at a given time point, A is the area (cm2) of the exposed tissue (0.01766 cm2), and t is elapsed time
 |
Permeability coefficients (P) were calculated using Fick's first law as indicated in Eq. (2), where L is the thickness of the BM/Ch preparation determined by SEM of cross-sections of mounted explants and ΔC describes the difference in moles of tracer between the two compartments of the Ussing chamber
 |
Gel Exclusion Chromatography
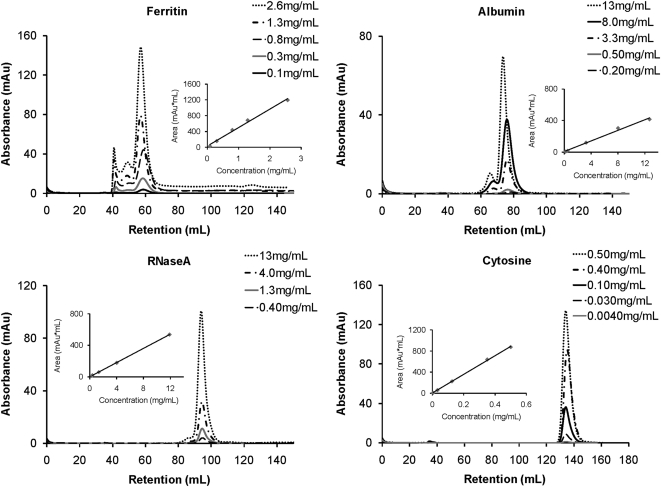
Tracers were quantified using gel exclusion chromatography with a 1.6 × 60 cm column (Hi-Prep Sephacryl S-300HR; Amersham, Pittsburgh, PA) equilibrated with PBS-CM. The column was developed at a linear flow rate of 15 mL cm−1 h−2 using an automated liquid chromatography system (AKTAprime; GE Healthcare Life Sciences) controlled by open source software (PrimeView, Version 1.0; GE Healthcare Life Sciences). Peaks were detected by their absorbance at 280 nm and peak areas determined by integration using the open source software (PrimeView). Solute concentration was determined by linear regression analysis using peak areas derived from known quantities of each test solute. Standard curves were derived individually for each solute as a function of concentration (see Fig. 4).
Figure 4.
Representative standard curves for tracer molecules. Chromatograms for the four individual tracers used in this study are shown with elution profiles for each tracer overlayed to show differences in peak area at different concentrations. Peaks were detected by their absorbance at 280 nm and peak areas determined by integration. Insets demonstrate the linear relationship between tracer concentration and peak area.
Statistical Analysis
Nonlinear regressions were obtained by using curve-fitting software (GraphPad Prism; GraphPad Software Inc, La Jolla, CA). An unpaired Student's t-test was used to compare calculated flux means, with two-tailed probability values, and α = 0.05 was used as the criterion to reject the null hypothesis of equality of means. All values are reported as mean ± SD.
Evaluation of Tissue Integrity
The integrity of the BM or Ch surface of tissue samples was evaluated at the end of each experiment by a scanning electron microscope (SEM) and transmission electron microscopy (TEM). For SEM, at the end of each experiment, x-ray film/tissue “sandwiches” were immersed in 3% gluteraldehyde in 25 mM phosphate buffer (pH 7) overnight at 4°C. The samples were rinsed in PBS, postfixed in 2% osmium tetroxide for 60 minutes, and dehydrated through a graded series of ethanol. Then the samples were critical point dried, mounted on a specimen stub with silver paste, and sputter coated with Au/Pd. Samples were imaged and photographed with a fully automated variable pressure SEM (Hitachi S-3400N Type II). Because orientation of the tissue on the specimen stub dictated the viewing angle of the image, measurements of BM/Ch thickness, images of the Ch side of tissue, and images of tissue with intact RPE were not made from samples used in diffusion experiments, but were performed on other tissue isolates. BM/Ch thickness was determined from SEM cross-sectional images (n = 3) obtained at a magnification of ×1000 using ImageJ software (developed by Wayne Rasband, National Institutes of Health, Bethesda, MD; available at http://rsb.info.nih.gov/ij/index.html). For TEM, tissue samples were fixed in 1% paraformaldehyde, 2% glutaraldehyde in 0.1 M Sorenson's phosphate buffer (pH 7.4) overnight at 4°C. After rinsing in 0.1 M Sorenson's phosphate buffer, samples were dehydrated and prepared for embedding (Araldite Epoxy Embedding Kit SPI-Pon 812; SPI Supplies, West Chester, PA). Samples were imaged at 80 kV with uranyl acetate staining (CM12 Phillips Transmission EM).
Results
The goal of our study was to measure differences in flux and permeability of macromolecules across BM/Ch as related to RS, and to do so using the smallest piece of tissue possible. The latter will facilitate future studies using small animals such as mice and to evaluate regional variations in diffusion across BM/Ch in human eyes. To accomplish this we applied a simple and inexpensive modification to a commercially available Ussing chamber to permit the use of small pieces of BM/Ch. As shown in Figure 1, this modification involves the use of an insert produced from two pieces of exposed x-ray film. A hole of any size can be drilled in the film and the tissue held in place between the two pieces by a thin film of silicon grease.
In our modified Ussing setup the ability to follow diffusion across BM/Ch requires that BM be intact for the duration of the experiment. To determine whether all five layers of BM are intact, we compared BM from eyes fixed immediately after enucleation and with the RPE intact (Fig. 2A) with BM/Ch preparations (Fig. 2B) by TEM. Figure 2 demonstrates that all five layers of BM remain intact after the procedure, with the only noticeable difference being the washout of plasma protein. Elastic and collagen fibers as well as the endothelial and RPE basement membranes remained intact. It should be noted that in all experiments it is the RPE basement membrane that is directly exposed to the fluid in the chamber.
Figure 2.
Transmission electron microscopy of BM/Ch preparations. (A) BM from an eye immediately fixed after enucleation and with RPE intact. (B) BM from a BM/Ch preparation. Scale bars, 500 nm. bm, basement membrane; ic, inner collagenous zone; elastic, elastic fiber layer; oc, outer collagenous zone; Endo, endothelium; RPE, retinal pigment epithelium.
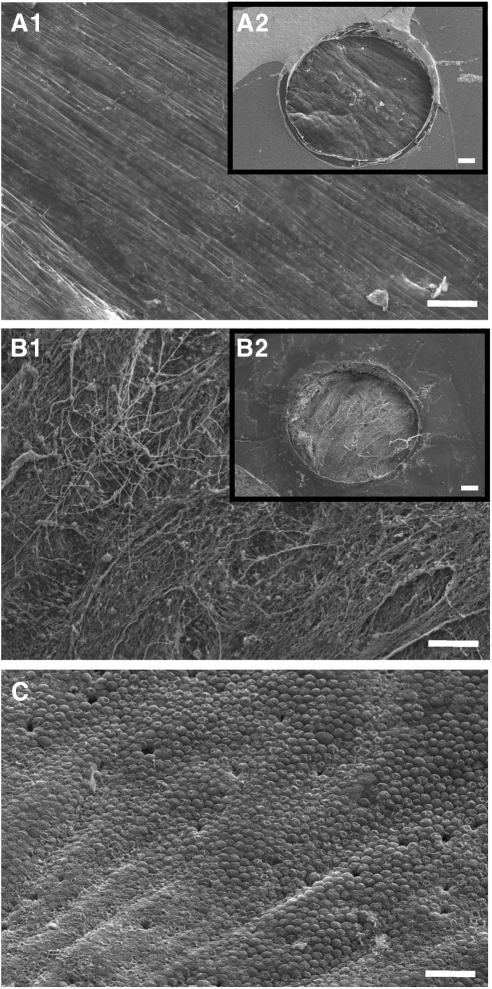
Since the integrity of BM could be compromised by poor dissection of the tissue, failure to remove RPE cells from BM, or the disintegration of the tissue during mounting, or during the time course of the experiment, the integrity of each BM/Ch preparation was evaluated at the end of each experiment using SEM. Figure 3 shows that RPE cells were successfully and completely removed from the surface of BM (compare Figs. 3A1 and 3A2 with 3C) without collateral damage to BM (Figs. 3A1, 3A2). BM appeared intact because there was no evidence of exposed collagen fibers, as would be predicted due to tearing of the basal lamina. Examination of the opposing surface revealed a web of connective tissue fibers resembling the suprachoiodal tissue that connects the Ch and sclera (Fig. 3B). We observed no evidence that the tissue had deteriorated during our experiments. Thickness (L) of BM/Ch explants was measured by SEM of explants in cross-section and was 58.1 ± 1.51 μm (mean ± SD, n = 3).
Figure 3.
Evaluation of tissue integrity via SEM. At the end of each experiment, tissues were fixed and prepared for SEM. (A1) The surface of BM, corresponding to the RPE-BL is relatively smooth, with no apparent gaps or tears. (A2) Low-magnification view of a representative “sandwich” of film and tissue (exposed at the opening) showing the entire 1.5-mm-diameter area of exposed BM. (B1) The outermost surface of the Ch consists of a web of fibers, indicating detachment from the sclera at the suprachoroidea. (B2) Low-magnification view of a representative tissue “sandwich” showing the entire 1.5-mm-diameter area of exposed suprachoidea. Vascular profiles are not visible because they are within the Ch. (C) Control preparation with RPE monolayer intact. Scale bars: (A1, B1, C) 50 μm; (A2, B2) 200 μm.
To determine how flux across BM/Ch is influenced by RS, we established a concentration gradient of all four tracer molecules across BM/Ch and applied Fick's first law to calculate the flux and permeability coefficient of each molecule (see the Materials and Methods section). Although others have used fluorescent tracers to measure flux across BM/Ch preparations, we found that this did not suit the design of our experiments. The reason for this was that we could not achieve a high enough specific activity of labeling of the reporter molecules to perform experiments with 1.8-mm2 tissue samples in a 24- to 48-hour experiment, and we wanted to be able to compare multiple tracers in the same experiment without introducing the need for each reporter to be differentially labeled. Furthermore, labeling of proteins with fluorescent tracers is typically accomplished by modification of the Ε amino acid of a lysine residue, which significantly alters charge characteristics and potentially affects RS. To circumvent these limitations we chose to use gel exclusion chromatography to quantify all four tracers, without structural modification, at each time point simultaneously. Examples of chromatograms and standard curves indicating the limits of detection for each standard are shown in Figure 4.
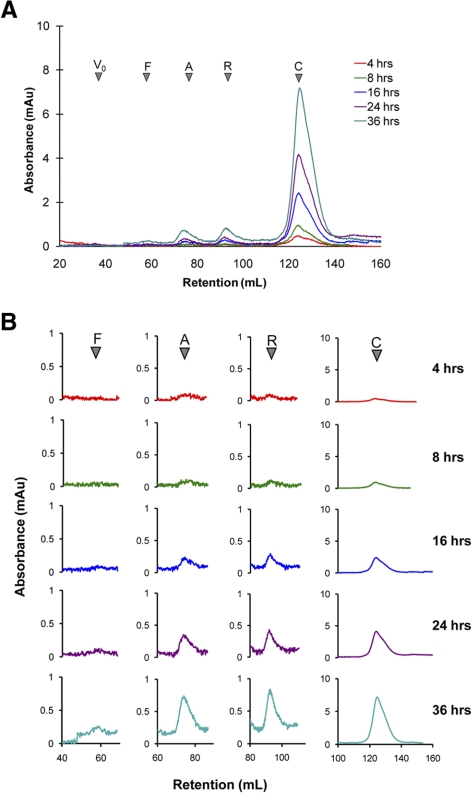
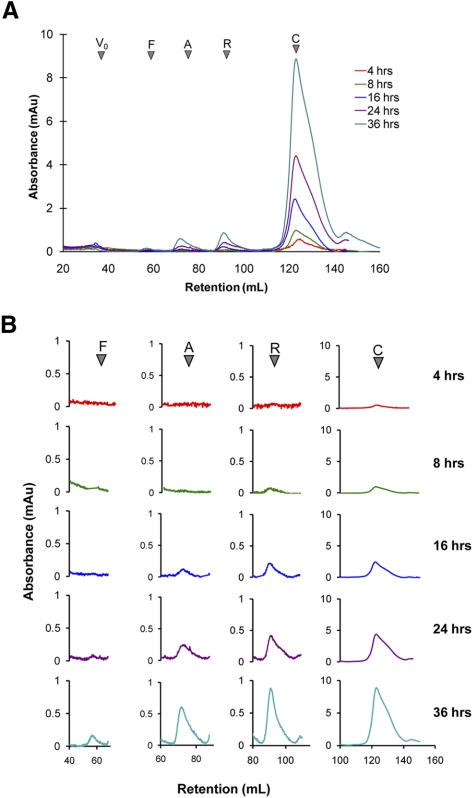
Experiments were performed to examine the diffusion of all four tracers in both the BM to Ch (Fig. 5) and Ch to BM (Fig. 6) directions. We were able to detect cytosine at the first time point of 4 hours regardless of the direction of diffusion (Figs. 5, 6). RNase A was quantifiable at 4 hours in the BM to Ch direction (Fig. 5) but was not quantifiable until 8 hours in the Ch to BM direction (Fig. 6). Similarly, albumin was first observed in the BM to Ch direction at 4 hours (Fig. 5) but the peak was too small to quantify; however, by 8 hours a significant amount of albumin was observed to have diffused. In the Ch to BM direction albumin was first detected at 16 hours (Fig. 6). Ferritin was first detected at 24 hours in the BM to Ch experiments (Fig. 6), but was reliably observed in the Ch to BM experiments only at the 36-hour time point (Fig. 5). Importantly, even at 36 hours, ferritin was not detected in every experiment in either direction. To ensure that our data were not skewed by absorption of the tracers to the explants, we quantified the amount of each tracer in both compartments at each time point. Essentially 100% of each tracer was recovered at each time point.
Figure 5.
(A) Representative chromatograms obtained for tracers in the BM to Ch direction. Elution profiles at different time points are overlayed as indicated. (B) Note that peaks can be examined using data acquisition software independently so that scaling can be varied to increase sensitivity. V0, void; F, ferritin; A, albumin; R, RNase A; C, cytosine.
Figure 6.
(A) Representative chromatograms obtained for tracers in the Ch to BM direction. Elution profiles at different time points are overlayed as indicated. (B) Note that peaks can be examined using data acquisition software independently so that scaling can be varied to increase sensitivity. V0, void; F, ferritin; A, albumin; R, RNase A; C, cytosine.
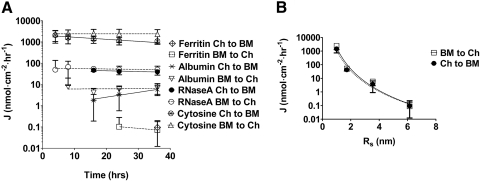
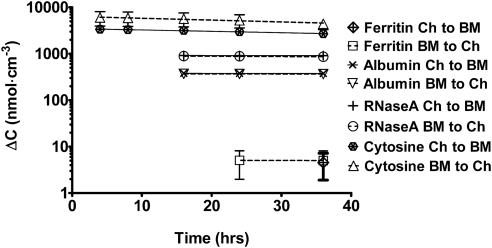
The flux of each tracer remained relatively constant throughout the time course of each experiment (Fig. 7A), although the diffusion of tracers did not have a significant impact on the concentration gradient through the time course of the experiment (Fig. 8). Flux was greatest for the smallest tracer, cytosine, and diminished with increasing RS (Fig. 7B). Ferritin had the slowest average flux (0.1 ± 0.08 nmol cm−2 h−1 from Ch to BM and 0.09 ± 0.14 nmol cm−2 h−1 from BM to Ch) and was detected only at the 36-hour time point in the Ch to BM direction and at the 24- and 36-hour time points in the BM to Ch direction. For all four tracers flux appeared greater in the BM to Ch direction compared with that in the Ch to BM direction (Fig. 6A). For cytosine and RNase A this difference was statistically significant (P < 0.05).
Figure 7.
Total diffusion flux and relationship to RS. (A) The flux of proteins through the tissue remained constant throughout the time course of the experiment. Runs in the Ch to BM direction are indicated by solid symbols and runs in the BM to Ch direction are indicated by open symbols. Dotted and solid lines represent a nonlinear semilog fit. (B) Flux plotted as a function of RS. Dotted and solid lines represent a nonlinear one phase exponential decay fit. Data points are given as mean ± SD.
Figure 8.
Change in concentration gradient of tracers as a function of time. Protein gradients in experiments performed from BM to Ch or Ch to BM as indicated. Lines are the regression fit through the data which are given as mean ± SD.
The permeability coefficient (P) for each tracer was calculated using Eq. (2) (see the Materials and Methods section) at each time point at which the tracer was detected. Like flux, P remained constant with time (Fig. 9A) and decreased with increasing RS for cytosine, RNase A, and albumin (Figs. 9A, 9B). In contrast to the difference in flux, however, P was similar for albumin and ferritin. Thus, we conclude that the size exclusion limit of BM exceeds the RS of ferritin, but that the permeability of BM to molecules with RS similar to or greater than that of albumin is limited, suggesting that albumin and ferritin are near the physical size exclusion limit of BM.
Figure 9.
Permeability coefficients (P) of tracers. (A) P remained relatively constant throughout the duration of the experiment. (B) P varied exponentially with RS but appeared to be saturated for albumin and ferritin.
Discussion
Studies of molecular diffusion through BM have been a valuable aid in understanding the effects of aging on BM function and suggest that the pathologic progression of AMD includes a diminished flux of nutrients and waste across BM.17–20 Prior studies examining the diffusion properties of BM have been performed on human tissues and age-matched controls but have always examined a single tracer or, when multiple tracers were used, they were examined serially rather than simultaneously. By using gel exclusion chromatography we have been able to determine flux and permeability coefficients for four tracers differing in mass and RS without altering the endogenous properties of these tracers by chemical modification of charged amino acids. Gel exclusion chromatography allows us to rule out any interaction between the individual tested molecules. Molar concentrations were calculated on both sides of the tissues and, by performing mole balance calculation, we can determine exactly how much of each protein diffused through. Any differences could be attributed to interaction of the molecule with the tissue. Also, differences in peak retention volumes or peak shapes can give us information on interaction of the molecules among themselves.
Furthermore, we have miniaturized the system to permit measurements to be made on pieces of tissue as small as (and potentially smaller than) 1.8 mm2. This miniaturization has the potential to allow comparative studies of diffusion using tissue from genetically altered mice or human tissue from a single donor dissected from the macula versus the periphery. In this work we used pig BM/Ch tissue as a tool to develop the method under study. Although the pig BM used was not subject to age-related alterations in composition and structure, such as lipid deposits and thickening, it has a structure and composition similar to those of human BM21,22 and is a popular model for the study of AMD.23,24
The flux values we obtained were compared with values obtained by other groups for molecules of similar mass. Hussain et al.11 examined the flux of amino acids ranging from 75.07 to 175.13 Da. Their values ranged from approximately 1400 nmol cm−2 h−1 (for phenylanine) to 3600 nmol cm−2 h−1 (for lysine). In our experiments, cytosine, whose molecular mass lies within the range studied for these amino acids, had fluxes of 2426 ± 1148 nmol cm−2 h−1 in the BM to Ch direction and 1462 ± 727 nmol cm−2 h−1 in the Ch to BM direction. Hussain et al.17 examined the flux of various fluorescent dextrans with mass ranging from 4.4 to 500 kDa. The larger dextrans exhibited flux of approximately 0.357 nmol cm−2 h−1. This value is higher than the flux we obtained for ferritin (<0.1 nmol cm−2 h−1 in either direction). This difference is likely due to the structure of dextrans.25 Dextran flux values are expected to be higher since they are randomly coiled linear polymers, whereas the tracers we used are globular proteins (except for cytosine).17 Dextrans and proteins of comparable mass react differently with water (dextrans are more hydrophilic) and studies on dextran diffusion have shown that they are less hindered than would be predicted on the basis of RS.25 However, diffusional flux alone may not be the best value for comparison between molecules. Flux is influenced by many factors, including the structural properties of the tissue, the tracer, the concentration gradient, and the time course of the experiment.
The relationship between P and RS was found to follow an exponential decline for molecules with RS equivalent to albumin (3.55 nm) and smaller. As explained elsewhere,26,27 porous diffusion through a fiber matrix, such as BM, roughly follows an exponential decline with molecular radius. Similar trends have been observed in diffusion of proteins through the sclera.28,29 When studied individually, small molecules (amino acids with mass similar to that of cytosine) were found to have an almost linear trend11 of flux relative to mass, whereas dextran macromolecules of differing size followed a power law relationship17,25,30 of flux relative to mass. Interestingly, the P of BM/Ch for ferritin was very similar to albumin despite the difference in their RS values (3.55 nm for albumin vs. 6.15 nm for ferritin). The change in relationship between permeability and RS for molecules of this size suggests that the functional size exclusion limit of BM in the pig is greater than 6.15 nm but that 6.15 nm is approaching that limit.
In this study we successfully established a method to evaluate the diffusion of both small and macromolecules through BM. The relationship between diffusivity and RS was found to be consistent with porous diffusion through a fiber matrix. As with all past studies on diffusion through BM/Ch, one limitation is the presence of the Ch and the longer path through the Ch than through BM itself. Although others have shown differences in the flux of tracers through BM in an AMD versus age-matched control eyes, there is still the need to investigate the underlying mechanisms causing these differences and the relative changes that occur in the macula versus the periphery. Also there is still the need to evaluate the diffusion of tracers with known importance to RPE function, such as serum retinol binding protein,31 secreted cytokines,32,33 and lipoproteins.9,34 The method presented herein will be a valuable tool in future studies seeking to understand differences in BM permeability in genetically altered animal models exhibiting sub-RPE deposits35 and in understanding differences in the regional permeability of BM in human donor tissue associated with AMD.
Footnotes
Supported, in part, by National Institutes of Health Grants EY13847 (LYM) and EY13160 (ADM), Macular Vision Research Foundation grant (ADM), and an unrestricted grant to the Department of Ophthalmology and Vision Science at the University of Arizona.
Disclosure: A. Zayas-Santiago, None; A.D. Marmorstein, None; L.Y. Marmorstein, None
References
- 1. Congdon N, O'Colmain B, Klaver CC, et al. Causes and prevalence of visual impairment among adults in the United States. Arch Ophthalmol. 2004;122:477–485 [DOI] [PubMed] [Google Scholar]
- 2. Allikmets R, Shroyer NF, Singh N, et al. Mutation of the Stargardt disease gene (ABCR) in age-related macular degeneration. Science. 1997;277:1805–1807 [DOI] [PubMed] [Google Scholar]
- 3. Marmorstein AD. The polarity of the retinal pigment epithelium. Traffic. 2001;2:867–872 [DOI] [PubMed] [Google Scholar]
- 4. Alder VA, Cringle SJ, Constable IJ. The retinal oxygen profile in cats. Invest Ophthalmol Vis Sci. 1983;24:30–36 [PubMed] [Google Scholar]
- 5. Starita C, Hussain AA, Patmore A, Marshall J. Localization of the site of major resistance to fluid transport in Bruch's membrane. Invest Ophthalmol Vis Sci. 1997;38:762–767 [PubMed] [Google Scholar]
- 6. Moore DJ, Hussain AA, Marshall J. Age-related variation in the hydraulic conductivity of Bruch's membrane. Invest Ophthalmol Vis Sci. 1995;36:1290–1297 [PubMed] [Google Scholar]
- 7. Marshall J, Hussain AA, Starita C, Moore DJ, Patmore AL. Aging and Bruch's membrane. In: Marmor MF, Wolfensberger eds. The Retinal Pigment Epithelium: Function and Disease. 1st ed New York: Oxford University; 1998:669–692 [Google Scholar]
- 8. Ethier CR, Johnson M, Ruberti J. Ocular biomechanics and biotransport. Annu Rev Biomed Eng. 2004;6:249–273 [DOI] [PubMed] [Google Scholar]
- 9. Curcio CA, Johnson M, Huang JD, Rudolf M. Apolipoprotein B-containing lipoproteins in retinal aging and age-related macular degeneration. J Lipid Res. 2010;51:451–467 [DOI] [PMC free article] [PubMed] [Google Scholar]
- 10. Moore DJ, Clover GM. The effect of age on the macromolecular permeability of human Bruch's membrane. Invest Ophthalmol Vis Sci. 2001;42:2970–2975 [PubMed] [Google Scholar]
- 11. Hussain AA, Rowe L, Marshall J. Age-related alterations in the diffusional transport of amino acids across the human Bruch's-choroid complex. J Opt Soc Am A Opt Image Sci Vis. 2002;19:166–172 [DOI] [PubMed] [Google Scholar]
- 12. Tserentsoodol N, Sztein J, Campos M, et al. Uptake of cholesterol by the retina occurs primarily via low density lipoprotein receptor-mediated process. Mol Vis. 2006;12:1306–1318 [PubMed] [Google Scholar]
- 13. Gordiyenko N, Campos M, Lee JW, Fariss RN, Sztein J, Rodriguez IR. RPE cells internalize low-density lipoprotein (LDL) and oxidized LDL (oxLDL) in large quantities in vitro and in vivo. Invest Ophthalmol Vis Sci. 2004;45:2822–2829 [DOI] [PubMed] [Google Scholar]
- 14. Meyer BJ, Ha YC, Barter PJ. Effects of experimental hypothyroidism on the distribution of lipids and lipoproteins in the plasma of rats. Biochim Biophys Acta. 1989;1004:73–79 [DOI] [PubMed] [Google Scholar]
- 15. El Harchaoui K, Arsenault BJ, Franssen R, et al. High-density lipoprotein particle size and concentration and coronary risk. Ann Intern Med. 2009;150:84–93 [DOI] [PubMed] [Google Scholar]
- 16. Cheville N. Ultrastructural Pathology: An Introduction to Interpretation. Iowa City, IA: Iowa State University; 1994 [Google Scholar]
- 17. Hussain AA, Starita C, Hodgetts A, Marshall J. Macromolecular diffusion characteristics of ageing human Bruch's membrane: implications for age-related macular degeneration (AMD). Exp Eye Res. 2010;90:703–710 [DOI] [PubMed] [Google Scholar]
- 18. Guo L, Hussain AA, Limb GA, Marshall J. Age-dependent variation in metalloproteinase activity of isolated human Bruch's membrane and choroid. Invest Ophthalmol Vis Sci. 1999;40:2676–2682 [PubMed] [Google Scholar]
- 19. Starita C, Hussain AA, Pagliarini S, Marshall J. Hydrodynamics of ageing Bruch's membrane: implications for macular disease. Exp Eye Res. 1996;62:565–572 [DOI] [PubMed] [Google Scholar]
- 20. Starita C, Hussain AA, Marshall J. Decreasing hydraulic conductivity of Bruch's membrane: relevance to photoreceptor survival and lipofuscinoses. Am J Med Genet. 1995;57:235–237 [DOI] [PubMed] [Google Scholar]
- 21. Kiilgaard JF, Andersen MV, Wiencke AK, et al. A new animal model of choroidal neovascularization. Acta Ophthalmol Scand. 2005;83:697–704 [DOI] [PubMed] [Google Scholar]
- 22. Nakaizumi Y. The ultrastructure of Bruch's membrane. I. Human, monkey, rabbit, guinea pig, and rat eyes. Arch Ophthalmol. 1964;72:380–387 [DOI] [PubMed] [Google Scholar]
- 23. Del Priore LV, Tezel TH, Kaplan HJ. Maculoplasty for age-related macular degeneration: reengineering Bruch's membrane and the human macula. Prog Retinal Eye Res. 2006;25:539–562 [DOI] [PubMed] [Google Scholar]
- 24. Lassota N, Kiilgaard JF, Prause JU, la Cour M. Correlation between clinical and histological features in a pig model of choroidal neovascularization. Graefes Arch Clin Exp Ophthalmol. 2006;244:394–398 [DOI] [PubMed] [Google Scholar]
- 25. Amu TC. Activation enthalpy of diffusion for well fractionated dextrans in aqueous solutions. Biophys Chem. 1982;16:269–273 [DOI] [PubMed] [Google Scholar]
- 26. Edwards A, Prausnitz MR. Fiber matrix model of sclera and corneal stroma for drug delivery to the eye. AIChE J. 1998;44:214–225 [Google Scholar]
- 27. Cooper ER, Kasting G. Transport across epithelial membranes. J Control Release. 1987;6:23–35 [Google Scholar]
- 28. Ambati J, Canakis CS, Miller JW, et al. Diffusion of high molecular weight compounds through sclera. Invest Ophthalmol Vis Sci. 2000;41:1181–1185 [PubMed] [Google Scholar]
- 29. Jackson TL, Hussain A, Morley AM, et al. Scleral hydraulic conductivity and macromolecular diffusion in patients with uveal effusion syndrome. Invest Ophthalmol Vis Sci. 2008;49:5033–5040 [DOI] [PubMed] [Google Scholar]
- 30. Schmidt M, Burchard W. Translational diffusion and hydrodynamic radius of unperturbed flexible chains. Macromolecules. 1981;14:210–211 [Google Scholar]
- 31. Duncan T, Fariss RN, Wiggert B. Confocal immunolocalization of bovine serum albumin, serum retinol-binding protein, and interphotoreceptor retinoid-binding protein in bovine retina. Mol Vis. 2006;12:1632–1639 [PubMed] [Google Scholar]
- 32. Shi G, Maminishkis A, Banzon T, et al. Control of chemokine gradients by the retinal pigment epithelium. Invest Ophthalmol Vis Sci. 2008;49:4620–4630 [DOI] [PMC free article] [PubMed] [Google Scholar]
- 33. Li R, Maminishkis A, Wang FE, Miller SS. PDGF-C and -D induced proliferation/migration of human RPE is abolished by inflammatory cytokines. Invest Ophthalmol Vis Sci. 2007;48:5722–5732 [DOI] [PubMed] [Google Scholar]
- 34. Huang JD, Presley JB, Chimento MF, Curcio CA, Johnson M. Age-related changes in human macular Bruch's membrane as seen by quick-freeze/deep-etch. Exp Eye Res. 2007;85:202–218 [DOI] [PMC free article] [PubMed] [Google Scholar]
- 35. Marmorstein AD, Marmorstein LY. The challenge of modeling macular degeneration in mice. Trends Genet. 2007;23:225–231 [DOI] [PubMed] [Google Scholar]


