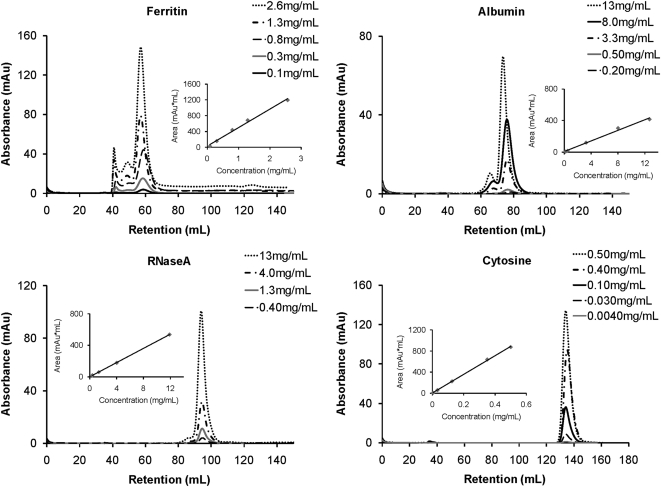
Figure 4.
Representative standard curves for tracer molecules. Chromatograms for the four individual tracers used in this study are shown with elution profiles for each tracer overlayed to show differences in peak area at different concentrations. Peaks were detected by their absorbance at 280 nm and peak areas determined by integration. Insets demonstrate the linear relationship between tracer concentration and peak area.

