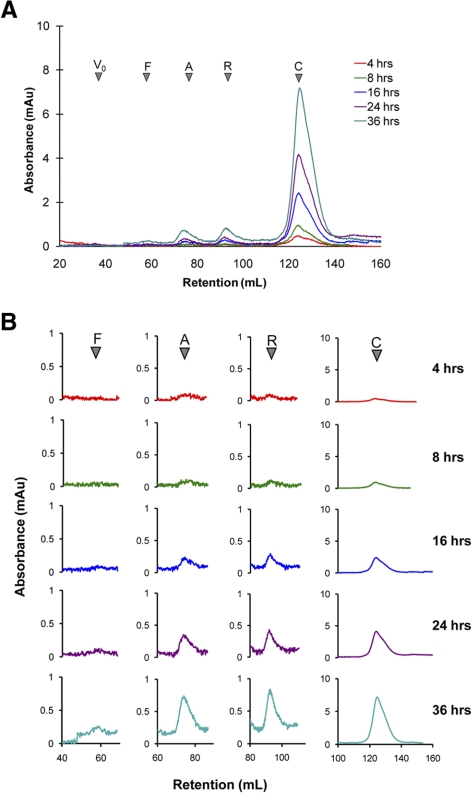
Figure 5.
(A) Representative chromatograms obtained for tracers in the BM to Ch direction. Elution profiles at different time points are overlayed as indicated. (B) Note that peaks can be examined using data acquisition software independently so that scaling can be varied to increase sensitivity. V0, void; F, ferritin; A, albumin; R, RNase A; C, cytosine.

