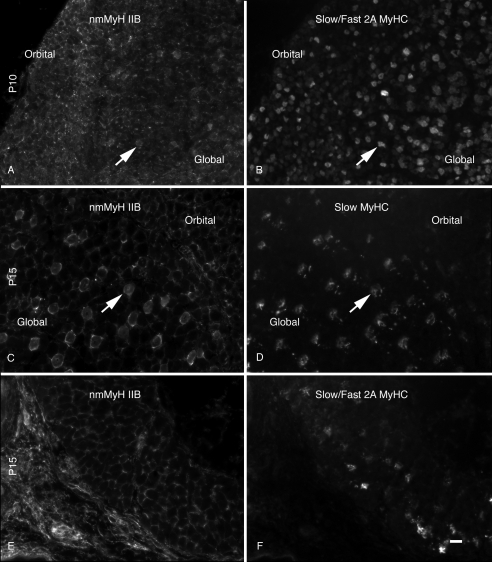
Figure 4.
Distribution of nmMyH IIB versus slow sarcomeric MyHC. Sections from the midbellies of developing orbits were stained for the distribution of nmMyH IIB (A, C, E) and counterstained for the distribution of slow MyHC (B, D) or slow/fast 2A MyHC (F). At P10 (A, B), the majority of the nmMyH IIB staining occurred at the peripheral edges of the fibers, but a few fibers exhibited intrafiber staining in the global layer that colocalized with fibers positive for the slow isoform (note arrows). At P15 (C, D), all the fibers that stained positive for the slow MyHC isoform in the global layer showed a distinct intrafiber staining pattern for nmMyH IIB (arrows). In contrast, the retractor bulbi at the same stage (E, F) did not exhibit the intrafiber distribution for nmMyH IIB despite the presence of slow/fast 2A-positive fibers. Scale bar, 10 μm.

