Figure 1.
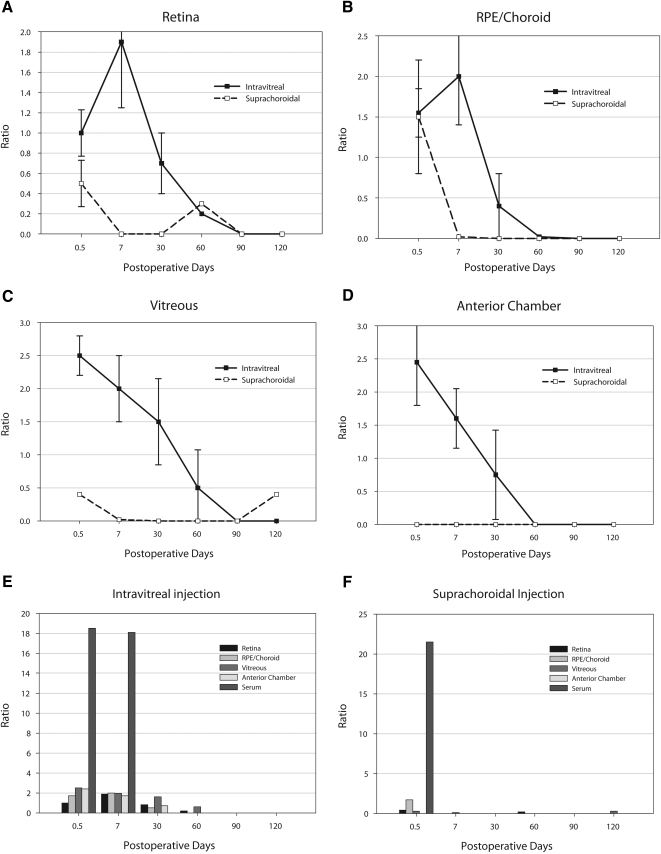
Pharmacokinetic graphs from study 1 (1.25 mg bevacizumab). All y-axis measurements are presented as a ratio comparing units of bevacizumab measured (micrograms)/total protein (milligrams) with error bars as ±SD. The x-axis measurements are in days after the initial injection. The 0.5-day time point was 12 hours after the initial injection. (A) Comparison of the intravitreal route (solid line) with the suprachoroidal route (dashed line) in all extracted retinal tissue. (B) Similar comparison from the entire RPE-choroidal tissue specimen. (C) Comparison from the vitreous, clearly indicating higher levels from a direct intravitreal injection. (D) Comparison of aqueous fluid. Note that there was no measurable bevacizumab level at any time point in the aqueous from the suprachoroidal injection. (E) Bar graph of the various tissues with serum levels from an intravitreal injection. (F) Similar bar graph of the various tissues showing serum levels after suprachoroidal injection. Average SD (as a percentage of the mean) was approximately 34%.

