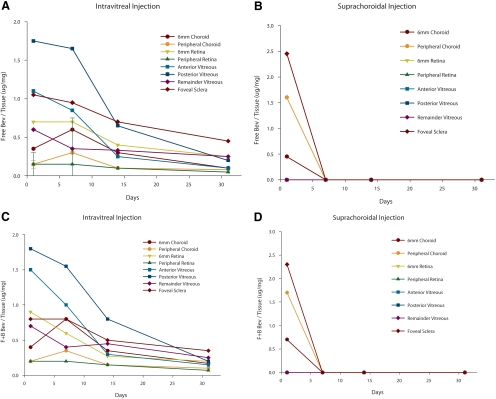
Figure 2.
Pharmacokinetic graphs from study 2 (3 mg bevacizumab). (A, B) The y-axes represented the ratio of free bevacizumab (micrograms)/total protein (milligrams). Each data point represents three specimens (SD not included because of the number of lines present). (C, D) The y-axes represent the sum of free and bound bevacizumab (micrograms)/total protein (milligrams). (A) Pharmacokinetic data of the free intravitreal injections in various tissues from 0.5 to 32 days after injection. Note that there is a predictable, gradual decline in tissue levels over time. (B) Similar profile of free bevacizumab injected by the suprachoroidal route. Note that after the 12-hour measurement, there are no tissue levels of drug by day 7 or thereafter, suggesting rapid drug disappearance. (C) Similar profile of free plus bound bevacizumab after intravitreal injection. Pharmacokinetics is similar to that in Figure 2A. (D) Similar profile is seen when free plus bound bevacizumab is measured after the suprachoroidal method of injection. Pharmacokinetics is similar to that in Figure 2B. Average SD (as a percentage of the mean) was approximately 29%.

