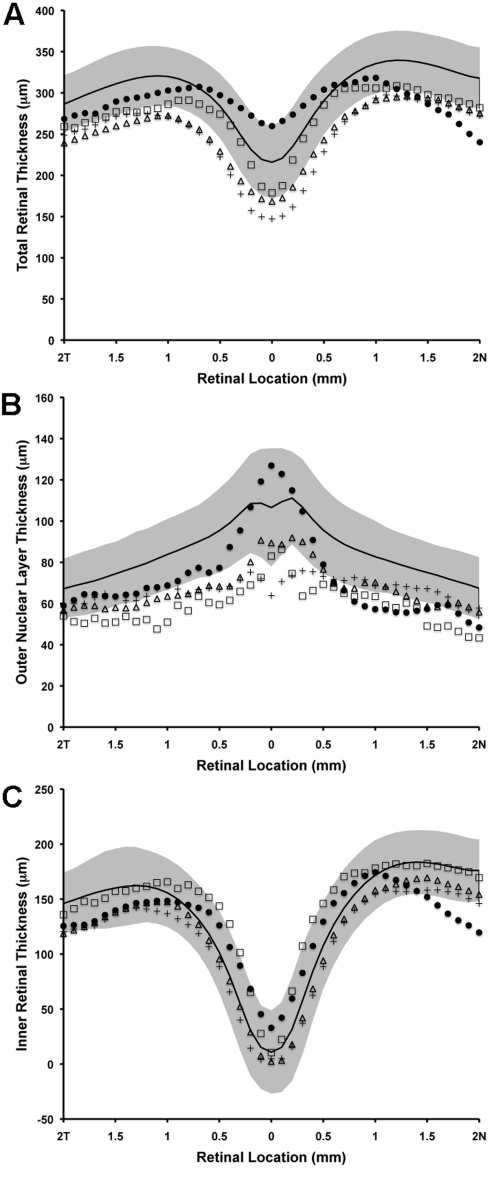
Figure 8.
Retinal thickness analysis along the horizontal meridian. (A) Total retinal thickness, (B) outer nuclear layer thickness, (C) inner retinal thickness. Solid black line represents mean values for 167 normal controls, with shaded region representing ±2 standard deviations from the mean. JC-071, filled circles; JC-160, crosses; JC-161, open triangles; RB-1002, open squares.

