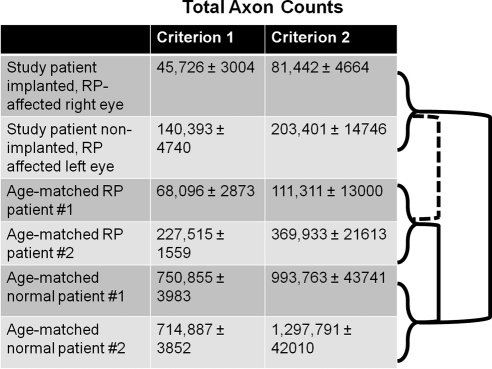
Figure 4.
Total axons in each optic nerve. Optic nerves from the study patient and age-matched RP patients had fewer total axons compared to the age-matched normal patients (P = 0.03 and 0.01, respectively, using criterion 1 and P = 0.026 and 0.045, respectively, using criterion 2). There was no significant difference in total axons between each of the study patient's optic nerves versus the two optic nerves from RP patients (P = 0.59 and 0.97 with criterion 1 and P = 0.61 and 0.89 with criterion 2 for study patient's right and left optic nerves, respectively). To the right of the chart, solid lines indicate statistical significance between groups; dashed lines indicate lack of statistical significance.

