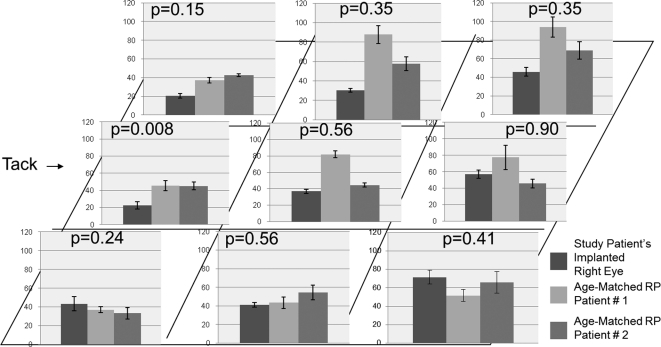
Figure 6.
Neuron counts in retinal cross-sections taken through nine (3 × 3) regions of the perimacular area in each of the three patients. Left column: study patient's right eye; middle and right columns: age-matched RP patients 1 and 2, respectively. The retina underlying the prosthesis in the study patient was compared with corresponding regions of the retina in the two age-matched RP patients to give the P values above each graph. See Figure 2 for the locations of each region. With the exception of the tack area (P = 0.008), there was no significant difference in the number of neurons between the study patient and the two RP controls in the other eight regions.

