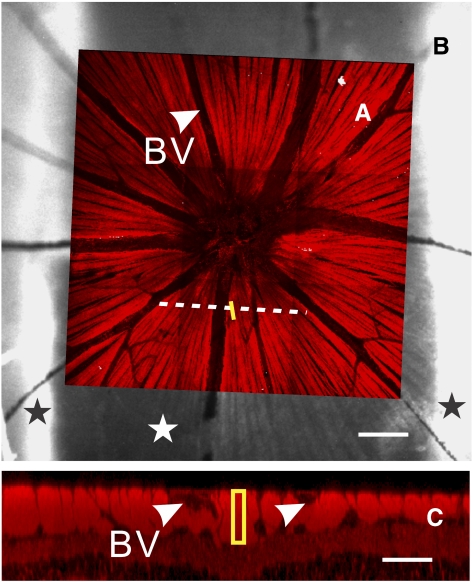
Figure 1.
Image registration and measurement of RNFL thickness. (A) En face confocal image of a normal retina (40× objective). Bright stripes are retinal nerve fiber bundles with fluorescent stain of microtubules. The image is registered to the reflectance image of the retina in (B). Yellow line: a bundle area selected for reflectance analysis. Dashed line: defined to derive a cross-sectional image of the bundles. (B) Reflectance image obtained at 440 nm. Black stars: portions of retina held by the mounting membranes; white star: retinal area across the slits of the membranes. Bundle reflectance was measured in this region. (C) Cross-sectional image along the dashed line in (A). Bundle thickness was measured as the length of the rectangle. Arrowheads and BV: blood vessels. Scale bar: (B) 100 μm; (C) 50 μm horizontally; 25 μm vertically.

