Figure 3.
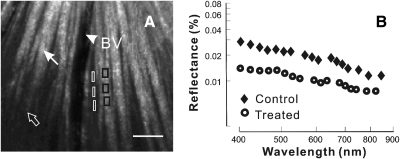
Reflectance of retinal nerve fiber bundles. (A) Reflectance image (440 nm) of a normal retina. At near on-peak, reflectance bundles (white arrow) appear as bright stripes against a darker background. The same bundles (open arrow) become dim at off-peak reflectance due to tissue tilt. Black boxes: bundle areas selected for reflectance analysis; white boxes: gap areas selected for background subtraction of the nearby bundle areas. Arrowhead and BV: blood vessel. Scale bar: 50 μm. (B) Reflectance spectra plotted on log-log coordinates. Reflectance was derived from bundle areas near the ONH (ra = 0.22 mm) in control and treated retinas. Bundle reflectance of both retinas decreased with increasing wavelength. However, the reflectance of the treated retina was lower than the control at all wavelengths.

