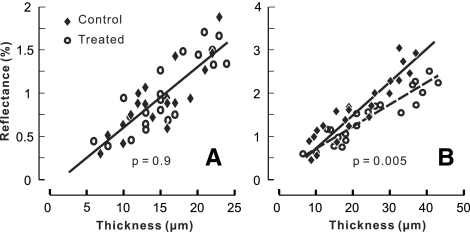
Figure 4.
Relation between average RNFL reflectance at 500 to 560 nm and thickness. The RNFL reflectance increased with increasing thickness. Bundle areas selected at rb = 0.33 mm (A) and ra = 0.22 mm (B). Linear regression parameters (± SE): (A) m = 0.07% ± 0.01%/μm and b = −0.11% ± 0.17% with R2 = 0.69 for the control group; m = 0.07% ± 0.01%/μm and b = −0.12% ± 0.16% with R2 = 0.73 for the treated group. The two fitted lines overlap. (B) m = 0.07% ± 0.01%/μm and b = 0.04% ± 0.17% with R2 = 0.85 for the control group; m = 0.05% ± 0.01%/μm and b = 0.21% ± 0.13% with R2 = 0.84 for the treated group.

