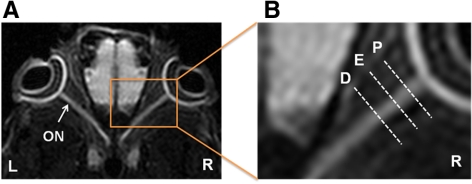
Figure 1.
Defining ROI in a control DWI map. Both eyeballs (L, left eye; R, right eye) and optic nerves (ON) are clearly seen in DWI. The ROI is defined as follows: proximal (P), 300 to 600 μm posterior to the globe; epicenter (E), approximately 900 to 1100 μm from the globe; distal (D), 1200 to 1600 μm posterior to the globe.

