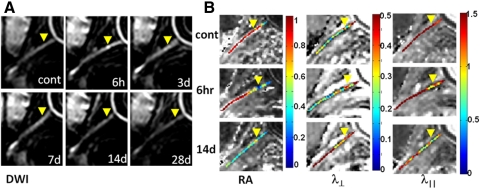
Figure 2.
Serial in vivo diffusion MRI of the crushed optic nerve from a mouse (A, DWI; B, DTI maps). Yellow arrowheads: epicenter. The optic nerve is hyperintense in DWI (A). Increased intensity is seen at the epicenter 6 hours after ONC. Optic nerve ROI was defined based on the DWI (Fig. 1). Significantly decreased RA resulting from the axonal injury extended the entire ON at 14 days (B). Progressive myelin damage reflected as the increased λ⊥ is also clearly demonstrated (B). Decreased λ‖ indicative of axonal injury after ONC clearly identified the epicenter (B). Image scales are as follow: RA, 0.0–1.0 (no unit); λ⊥, 0.0–0.5 (μm2/ms); λ‖, 0.0–1.5 (μm2/ms).

