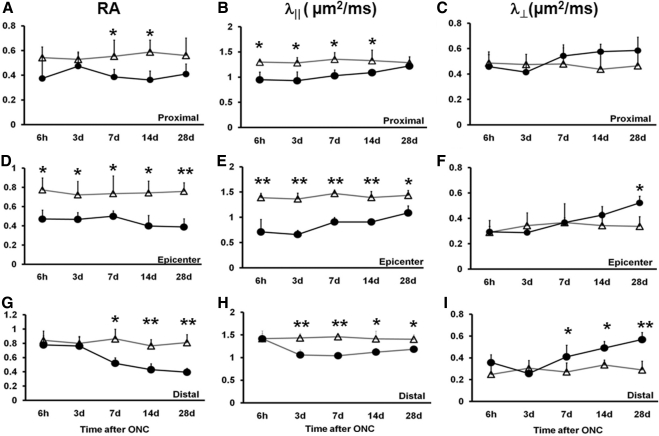
Figure 3.
The time course of DTI parameters measured from longitudinal analysis of crush-injured optic nerves (circles) and uninjured optic nerves (triangles). RA, λ‖, and λ⊥ of proximal, epicenter, and distal ROI are displayed as mean ± SD (n = 5). At the proximal site, the RA value decreased from day 7 (A), λ‖ values significantly decreased from 6 hours (B), and λ⊥ increased around day 14 (C). At the epicenter, significant decreases in RA and λ‖ were seen at all time points (D, E). Significantly increased λ⊥ was seen only at 28 days (F). At the distal site, a changed RA value was observed from day 7 (G), significantly decreased λ‖ started at day 3 (H), and λ⊥ was significantly increased at day 7 (I). Statistical differences indicated in relation to control group: *P < 0.05, **P < 0.01, two-way ANOVA.

