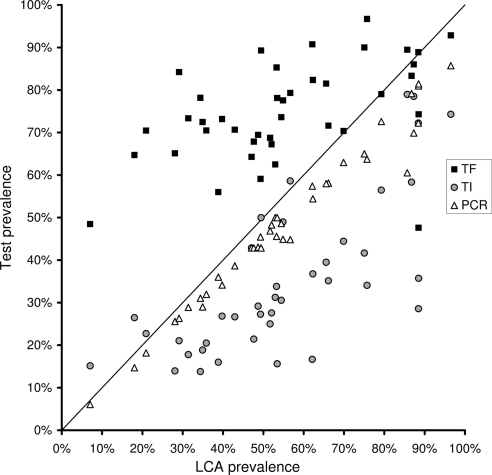
Figure 2.
Village-level prevalence of each test for trachoma (y-axis) versus the prevalence of the latent gold standard (LCA, x-axis). Each data point represents the prevalence of positive tests from a single village, with multiple tests from the same village aligned vertically. The diagonal line represents the performance of a perfect test.

