Figure 1.
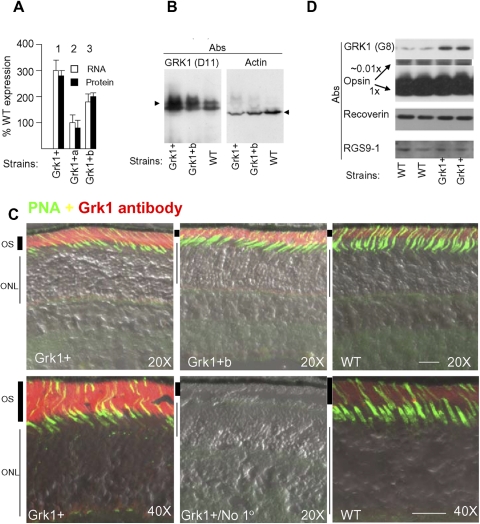
Grk1 expression in transgenic mouse lines. (A) The mouse lines were generated by transgenesis with a BAC containing the full-length mouse Grk1 gene and its entire flanking sequences. The eye expression levels were quantified in the three strains using real-time RT-PCR (empty bars) and quantitative immunoblotting (filled bars). For real-time RT-PCR and quantitative immunoblots the data from individual mouse samples in triplicates were averaged at various RNA or protein loads to ensure consistency. The error bars represent SEM. Relative Grk1 expression in Grk1+/− were quantified previously by Doan et al. at 0.32 ± 0.03 the WT levels using quantitative immunoblots.11 (B) Immunoblot shows overexpression of GRK1 bands in the overexpressing Grk1+ and Grk1+b strains. The immunoblot was probed with monoclonal antibody D11 against an amino terminal domain epitope, which recognizes both full-length and presumably the alternatively spliced truncated form of GRK1 previously described.37,38 For comparison the same blot probed with actin antibody is shown. The WT sample was intentionally overloaded to qualitatively demonstrate the GRK1 overexpression in the transgenic samples. Immunoblots from six animals were compared with WT in this manner. (C) Cryosections of eyes from Grk1+, Grk1+b, and WT strains were reacted with 8585 polyclonal anti-GRK1 antibody (red) and the cone sheath marker peanut neuroagglutinin (PNA, green). Images show uniform overexpression of GRK1 with correct localization in outer segments (OS) across photoreceptors. Sections 10-μm thick were incubated with identical cocktail of primary antibodies except the one control that lacked any primary reactants (No 1o). They were subsequently incubated with the secondary Alexa- 488 and 568 antibodies. The same excitation and acquisition parameters were used on a confocal microscope (Zeiss meta LSM; Carl Zeiss, Germany) for obtaining 12 bit depth images with the sensitivities set so that the signal intensities from Grk1+ tissue did not saturate the photomultiplier. The images were processed with the software designed for the confocal microscope. Objective lens magnifications indicated by 20× and 40×. Twenty micrometer scale bar is shown on each of the image panels (bottom). ONL, outer nuclear layer. (D) Immunoblot of rod outer segments showing that other key components of the recovery pathway including opsin, Rgs9-1, and recoverin are unaffected by GRK1 overexpression.

