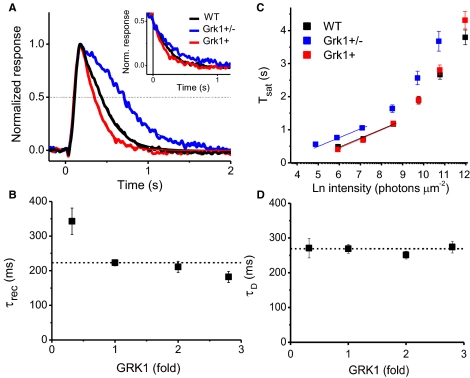
Figure 4.
(A) Normalized dim flash responses of WT (black), Grk1+ (red), and Grk1+/− (blue) rods. The recovery time constant for each cell was estimated by fitting the second half of the recovery phase of dim flash responses with a single exponential function (inset). The recovery phases of dim flash response for each genotype aligned at the point of the half-peak amplitude. (B) Plot of the recovery time constant, τrec, as a function of GRK1 expression, scaled to WT levels. The recovery time constant was shortened with increasing GRK1 expression. (C) Time in saturation of responses against the flash intensities for WT (black), Grk1+ (red), and Grk1+/− (blue) rods. The dominant time constant of recovery was estimated from the slopes of fitting line for the first phase. (D) Plot of the dominant time constant, τD, as a function of GRK1 expression, scaled to WT levels. The dominant time constant was unaffected by GRK1 expression levels.

