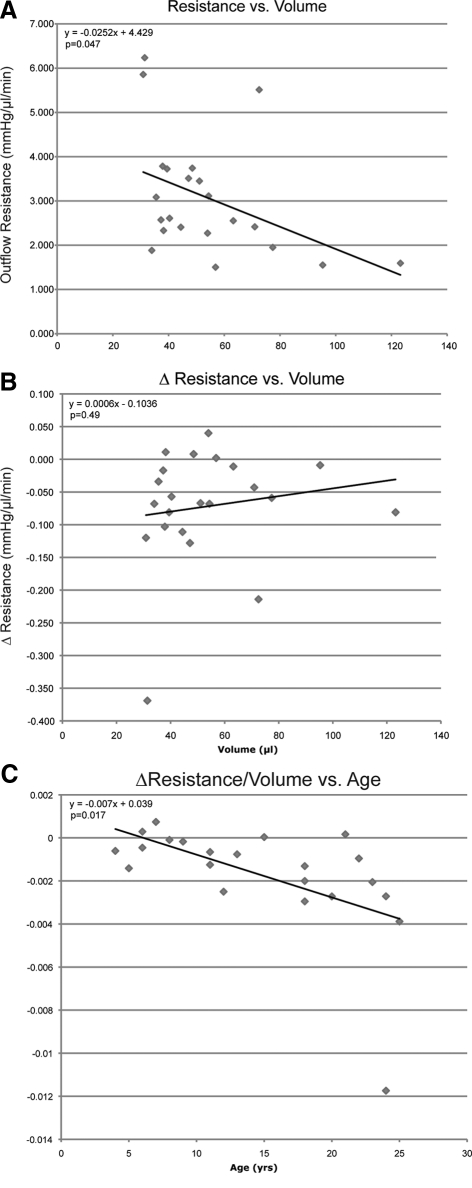
Figure 2.
Total volume perfused versus resistance (A) and rate of change in resistance (B) at baseline in 22 rhesus monkeys each contributing one eye. Solid line represents least-squares linear regression of resistance or change in resistance on volume. Age (years) versus rate of change in resistance corrected for total volume perfused [(mm Hg/μL/min)/μLtot] (C) at baseline in 22 rhesus monkeys each contributing one eye. Solid line represents least-squares linear regression of resistance washout, corrected for total volume, on age. Equation represents multiple regression analysis of change in resistance, accounting for volume, on age.

