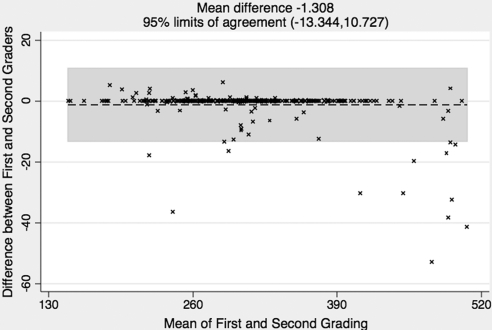
Figure 6.
Bland Altman plot of intergrader agreement on CT measurements for all macular subfields together between the two graders. The × symbol represents a set of first and second grading for the same CT measurement. Each of the measurements is then represented on the graph by assigning the mean of the two gradings as the x-axis value, and the difference between the two gradings as the y-axis value. The overall mean difference is shown as a dashed line; the 95% limits of agreement lie within the gray box. The variation is relatively small for this data set.

