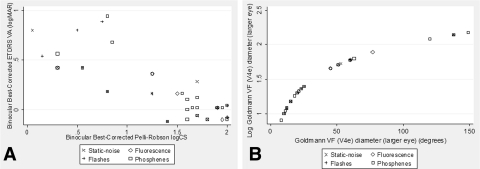
Figure 1.
Scatterplots demonstrating the relationship between (A) binocular best corrected ETDRS VA and CS and (B) logVF diameter and VF diameter in the larger eye with the V4e target. Each point represents a subject and the type of photopsia(s) they noted; overlapping symbols indicate that a subject reported more than one type.

