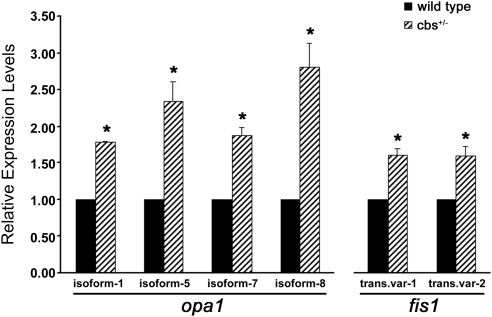
Figure 1.
Expression of Opa1 and Fis1 is increased in neural retinas of cbs+/− mice. Fold change in expression of Opa1 isoforms and Fis1 transcript variants as determined by quantitative real-time polymerase chain reaction analysis. Expression levels in retinas of cbs+/− mice were as follows: Opa1-isoform 1, 1.79 ± 0.01 of wild-type, P < 0.0002; Opa1-isoform 5, 2.35 ± 0.27 of wild-type, P < 0.037; Opa1-isoform 7, 1.87 ± 0.11 of wild-type, P < 0.016; Opa1-isoform 9, 2.81 ± 0.32 of wild-type, P < 0.03; Fis1-transcript variant 1, 1.61 ± 0.09 of wild-type, P < 0.02; Fis1-transcript variant 2, 1.60 ± 0.14 of wild-type, P < 0.05. *Significantly different from wild-type.

