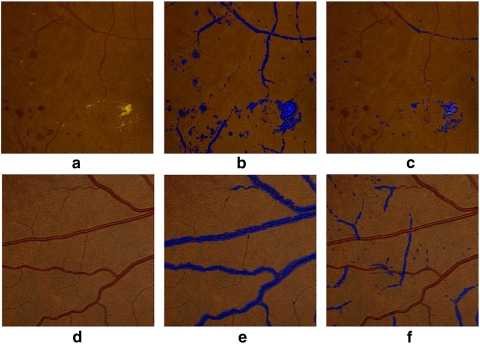
Figure 4.
Structures in the retina captured by the AM-FM estimates using high values of the IA (blue). (a) Region of a retinal image with pathologies; (b) image representation using medium frequencies, which captures dark and bright lesions as well as vasculature; (c) image representation using high frequencies. Note that this image captures most of the bright lesions; (d) region of a retinal image with normal vessel structure; (e) image representation using a very low frequency filter; (f) Image representation of (d) obtained by taking the difference between the very low and the ultralow frequency scales, in this image the thinner vessels are better represented.

