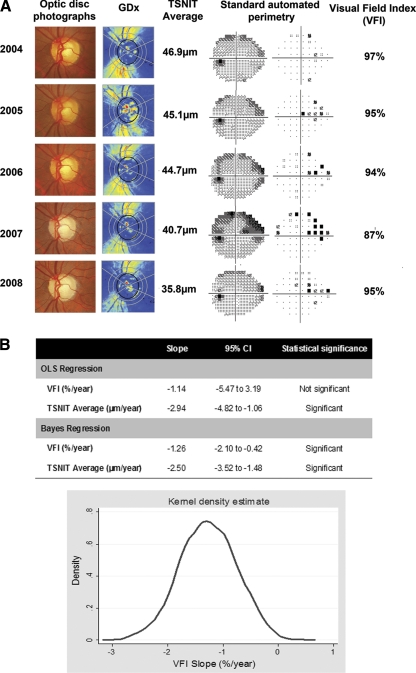
Figure 6.
(A) SAP and SLP results in an eye that had progressive glaucomatous optic neuropathy over time on optic disc stereophotographs. There was progressive RNFL thinning, as shown by the color-coded map and a decrease in TSNIT average values over time. SAP shows progressive visual field defect on the superior nasal sector. (B) Slopes of change for VFI and TSNIT average obtained by OLS regression and the combined Bayesian method for the examinations shown in (A). The OLS regression slope for VFI was not statistically significant, whereas the Bayesian VFI slope was significantly less than 0. The Bayesian slope for the functional test (VFI) was influenced by the presence of significant changes in the structural test (TSNIT average). The graph shows the kernel density estimate for the posterior distribution of the slope of VFI change obtained by the Bayesian hierarchical model.

