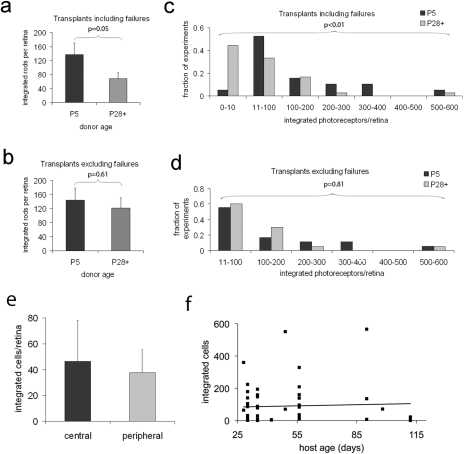
Figure 3.
Mature photoreceptors integrate into the adult retina. (a, c) The average number of integrated cells per retina for P5 and P28+ donors, respectively (N = 19 for P5, N = 36 for P28+; P = 0.05; Student's t-test). These experiments are binned by integrated cells per retina in (c) and show significantly different distributions (P < 0.01; Mann-Whitney U test). (b, d) The average number of integrated cells per retina when failures (transplants with <10 integrated rods) are excluded (N = 18 for P5, N = 20 for P28+; P = 0.6; Student's t-test). In (f), these experiments are again binned by integrated cell number, and distributions of P5 and P28+ cells are no longer significantly different when failures are excluded (P = 0.81; Mann-Whitney U test). (e) Central and peripheral retinal cells from a 290-day-old mouse show similar integration. (f) Summary of transplanted cells into host animals from 30 days to >100 days of age to show the lack of a relationship between host age and the number of integrated cells.

