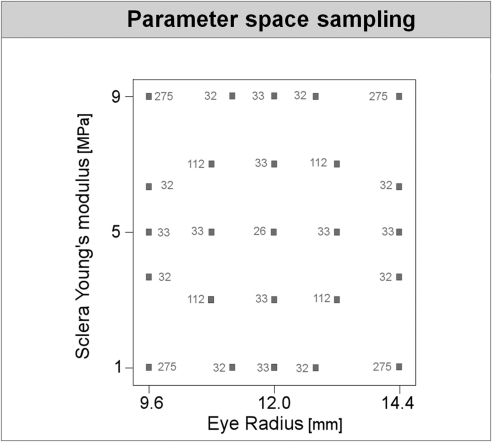
Figure 3.
The combination of parameters used. Each small square represents a combination of parameters. Shown is a two-dimensional projection onto the axes of eye radius and sclera Young's modulus. The number next to a square is the number of combinations that overlap in this projection. For example, 33 models were analyzed with an eye radius of 9.6 mm and sclera Young's modulus of 5 MPa. The 33 models varied in the other parameters. The sampling scheme was such that for any two parameters the two-dimensional projection looks identical with the example shown here, for a total of 2092 models.

