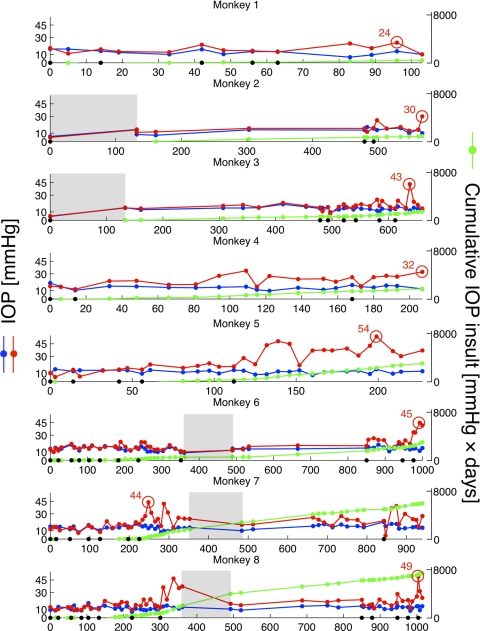
Figure 1.
Postlaser-detected IOP in both eyes of each monkey (blue: normal eye; red: lasered eye). For each animal, time 0 corresponds to the first laser session, and the last day to the date of the monkey's death. Black dots along the x-axis signify each laser session. For each monkey, cumulative IOP insult (green curve in mm Hg × days; scale on the right) was defined as the difference in area under the IOP time curve between the lasered and the normal eyes. The animals were ordered such that monkey 1 received the lowest cumulative IOP insult, and monkey 8 the highest. Maximum detected IOP in each lasered eye is shown with a red circle. Shaded area: (August 30, 2005 to December 15, 2005) represents the period immediately after Hurricane Katrina, during which IOP could not be measured in monkeys 2, 3 and 6 to 8 (see the Limitations section of the Discussion). For these monkeys, an additional period of diminished frequency of IOP measurement occurred as the laboratory was becoming fully operational at Devers. Finally, note that the x-axis scale is not common to all animals and that chronic IOP elevations of different magnitude and duration were achieved in each lasered eye (also see Table 1).

