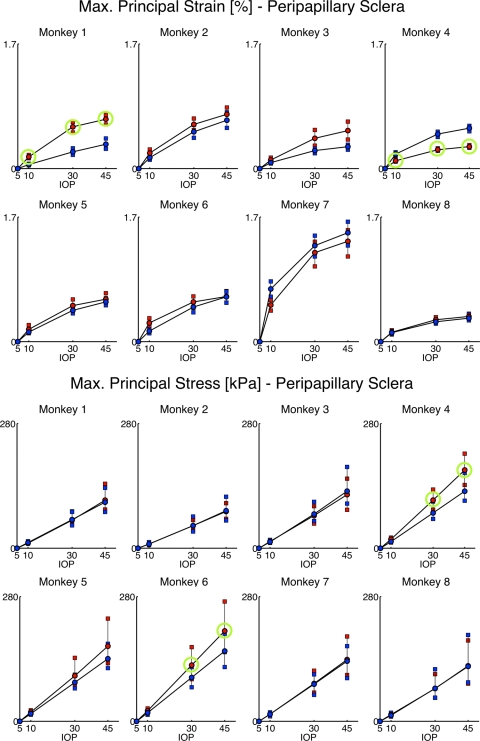
Figure 8.
Maximum principal strain (top) and stress (bottom) in the peripapillary sclera in both eyes (blue: normal, red: glaucomatous) of each monkey as a function of IOP. Error bars show the 25th, 50th, and 75th percentiles. Green circle: represents a significant difference between the normal and glaucomatous eye (when the t-statistic is greater than the intereye differences in the eight normal monkeys). Note that the maximum principal strain is a nonlinear function of IOP and the maximum principal stress is a linear function of IOP.

