Figure 1.
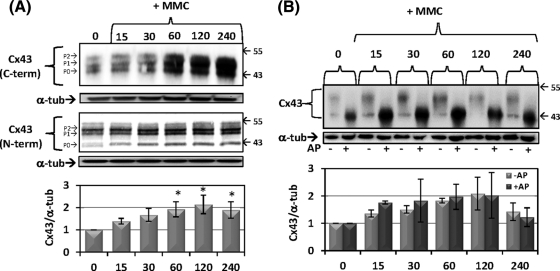
Rapid accumulation of Cx43 protein in response to genotoxic stress with mitomycin C. Cells were treated with prewarmed media containing 5 μM MMC for indicated times in minutes. (A) Western blot for total Cx43 using C-terminal antibody (top) and N-terminal antibody (bottom) from independent experiments. Blots were stripped and reprobed for α-tubulin as a loading control. Quantification below is ratio of Cx43/α-tubulin normalized to values at the “0” time point. Asterisks indicate statistically significant differences from time “0” (ANOVA, P < 0.05; Dunnett's multiple comparison test, P < 0.05). Blots are representative of eight independent experiments and the mean fold change ± SEM is shown in the graph. (B) Alkaline phosphatase (AP) treatments of cell lysates were followed by immunoblotting. Quantification in the graph is the ratio of Cx43/α-tubulin normalized to “0” for either AP– or AP+. Differences between “–AP” and “+AP” at each time point were not statistically significant (2-way ANOVA, P > 0.05). The blot is representative of three independent experiments and the mean fold change ± SEM is shown in the graph.

