Figure 6.
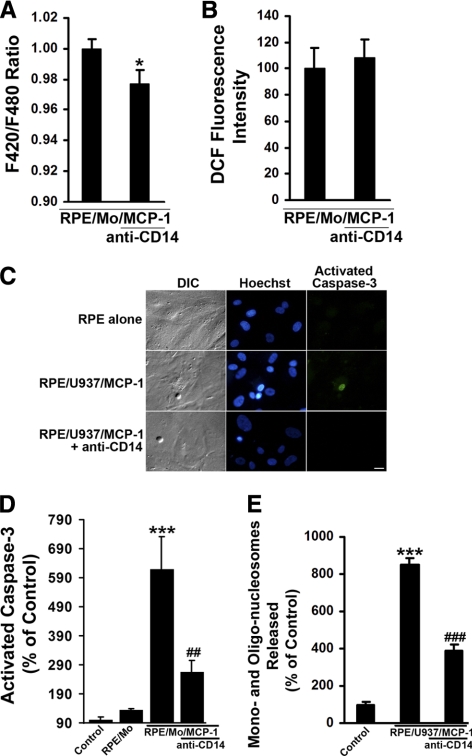
Effects of anti-CD14 on activated monocyte-induced RPE Ca2+ levels, ROS production, and apoptosis. (A) Activated monocytes-induced RPE Ca2+ levels were measured using a fluorometer (FlexStation Scanning Fluorometer; Molecular Devices) in the presence or absence of antibody directed against CD14. RPE cells were loaded with a Ca2+ indicator dye (Fura red-AM; 10 μM), for 1.5 hours at 37°C. After incubation with anti-CD14 antibody for 1 hour, RPE cells were challenged with MCP-1–activated monocytes (RPE/Mo/MCP-1). (B) CM-H2DCFDA–prelabeled RPE cells were preincubated with or without anti-CD14 antibody for 1 hour, and then exposed to MCP-1–activated monocytes in the presence or absence of anti-CD14 antibody. Fluorescence intensities were measured. (C) Differential interference contrast (DIC) and fluorescence images of cells stained with Hoechst 33342 and caspase-3 substrate (NucView 488; Biotium, Inc.) in RPE cells exposed control medium (RPE alone), or MCP-1–activated U937 cells (RPE/U937/MCP-1) in the presence or absence of anti-CD14 antibody for 6 hours. Scale bar, 20 μm. (D) RPE cells were preincubated with or without anti-CD14 antibody for 1 hour, and then exposed to control medium (RPE alone), monocytes (RPE/Mo), or MCP-1–activated monocytes in the presence or absence of anti-CD14 antibody. After 6 hours, the number of cells with activated caspase-3 was determined after staining with caspase-3 substrate. (E) RPE cells were treated as described in (C) for 24 hours. DNA fragmentation or released mono- and oligonucleosomes were measured by a cell death detection ELISA. Data are presented as mean ± SEM (n = 3–12). *P < 0.05, ***P < 0.001, compared with control or RPE/Mo/MCP-1 (without antibody); ##P < 0.01, ###P < 0.001, compared with RPE/Mo/MCP-1 or RPE/U937/MCP-1 (without antibody).

