Figure 6 .
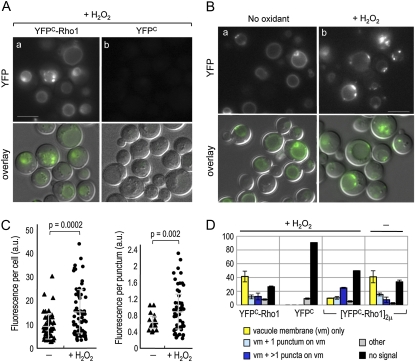
The Rho1–Ycf1 bimolecular fluorescent complex formation after exposure to H2O2. (A) BiFC assays were performed in the YCF1–VN strain (HPY1710), carrying (a) pRS316–YFPC–RHO1 or (b) YCp–YFPC (pHP1730). Cells were grown in SC−Ura at 30° and incubated with 2 mM H2O2 for 2 hr before imaging. Images were captured, analyzed, and presented as in Figure 4B. Bar, 5 μm. (B) BiFC assays were performed in HPY1710, carrying pRS426–YFPC–RHO1. Cells were grown in SC−Ura at 30° and incubated with 2 mM H2O2 for 4 hr (+H2O2) or mock treated (no oxidant) before imaging. Images were captured, analyzed, and presented as in Figure 4B. Bar, 5 μm. (C, left) Fluorescence intensity of individual cells of HPY1710 with pRS426–YFPC–RHO1 was plotted and quantified using ImageJ software: pixel intensity in untreated cells, 9.57 ± 5.4 (in a.u.) and in cells treated with 2 mM H2O2 for 4 hr, 15.1 ± 9.9 (in a.u.) (P = 0.0002). (C, right) Fluorescence intensity of each punctum in HPY1710 with pRS426–YFPC–RHO1 was analyzed similarly: pixel intensity in untreated cells, 0.64 ± 0.1 (in a.u.) and in cells treated with 2 mM H2O2 for 4 hr, 0.94 ± 0.5 (in a.u.) (P = 0.002). (D) Localization pattern of the Rho1–Ycf1 bimolecular fluorescent complex was analyzed as in Figure 5B from strains HPY1710 with pRS316–YFPC–RHO1, YCp–YFPC, or pRS426–YFPC–RHO1 after treatment with H2O2 for 4 hr and HPY1710 with pRS426–YFPC–RHO1 after mock treatment. Data are from three independent experiments (n = 300–400), and mean (%) ± SD are shown.

